rnalysis.filtering.CountFilter.split_hierarchical
- CountFilter.split_hierarchical(n_clusters: PositiveInt | List[PositiveInt] | Literal['gap', 'silhouette', 'calinski_harabasz', 'davies_bouldin', 'bic', 'distance'], metric: Literal['Euclidean', 'Cosine', 'Pearson', 'Spearman', 'Manhattan', 'L1', 'L2', 'Jackknife', 'YS1', 'YR1', 'Sharpened_Cosine'] = 'Euclidean', linkage: Literal['Single', 'Average', 'Complete', 'Ward'] = 'Average', power_transform: bool = True, distance_threshold: float | None = None, plot_style: Literal['all', 'std_area', 'std_bar'] = 'all', split_plots: bool = False, max_n_clusters_estimate: PositiveInt | Literal['auto'] = 'auto', parallel_backend: Literal['multiprocessing', 'loky', 'threading', 'sequential'] = 'loky', gui_mode: bool = False) Tuple[CountFilter, ...] | Tuple[Tuple[CountFilter, ...], ...]
Clusters the features in the CountFilter object using the Hierarchical clustering algorithm, and then splits those features into multiple non-overlapping CountFilter objects, based on the clustering result.
- Parameters:
n_clusters (int, list of ints, 'distance', 'gap', 'silhouette', 'calinski_harabasz', 'davies_bouldin', or 'bic') – The number of clusters the algorithm will seek. If set to ‘distance’, the algorithm will derive the number of clusters from the distance threshold (see ‘distance_threshold’).
metric ('Euclidean', 'l1', 'l2', 'manhattan', or 'cosine', (default='Euclidean')) – the distance metric used to determine similarity between data points. If linkage is ‘ward’, only the ‘Euclidean’ metric is accepted. For a full list of supported distance metrics see the user guide.
linkage ('single', 'Average', 'complete', or 'ward' (default='Average')) – Which linkage criterion to use. The linkage criterion determines which distance to use between sets of observation. The algorithm will merge the pairs of cluster that minimize this criterion.
power_transform (bool (default=True)) – if True, RNAlysis will apply a power transform (Box-Cox) to the data prior to clustering.
distance_threshold (float or None (default=None)) – a distance threshold above which clusters will not be merged. If a number is specified, n_clusters must be None.
plot_style ('all', 'std_area', or 'std_bar' (default='all')) – determines the visual style of the cluster expression plot.
split_plots (bool (default=False)) – if True, each discovered cluster will be plotted on its own. Otherwise, all clusters will be plotted in the same Figure.
max_n_clusters_estimate (int or 'auto' (default='auto')) – the maximum number of clusters to test if trying to automatically estimate the optimal number of clusters. If `max_n_clusters_estimate`=’default’, an appropriate value will be picked automatically.
parallel_backend (Literal[PARALLEL_BACKENDS] (default='loky')) – Determines the babckend used to run the analysis. if parallel_backend not ‘sequential’, will calculate the statistical tests using parallel processing. In most cases parallel processing will lead to shorter computation time, but does not affect the results of the analysis otherwise.
- Returns:
if n_clusters is an int, returns a tuple of n_clusters CountFilter objects, each corresponding to a discovered cluster. If n_clusters is a list, returns one tuple of CountFilter objects per value in n_clusters.
- Examples:
>>> from rnalysis import filtering
>>> dev_stages = filtering.CountFilter('tests/test_files/elegans_developmental_stages.tsv')
>>> dev_stages.filter_low_reads(100)
Filtered 44072 features, leaving 2326 of the original 46398 features. Filtered inplace.
>>> clusters = dev_stages.split_hierarchical(n_clusters=13, metric='Euclidean',linkage='ward'
...                                         ,power_transform=True)
Filtered 1718 features, leaving 608 of the original 2326 features. Filtering result saved to new object.
Filtered 1979 features, leaving 347 of the original 2326 features. Filtering result saved to new object.
Filtered 2094 features, leaving 232 of the original 2326 features. Filtering result saved to new object.
Filtered 2110 features, leaving 216 of the original 2326 features. Filtering result saved to new object.
Filtered 2156 features, leaving 170 of the original 2326 features. Filtering result saved to new object.
Filtered 2191 features, leaving 135 of the original 2326 features. Filtering result saved to new object.
Filtered 2195 features, leaving 131 of the original 2326 features. Filtering result saved to new object.
Filtered 2223 features, leaving 103 of the original 2326 features. Filtering result saved to new object.
Filtered 2224 features, leaving 102 of the original 2326 features. Filtering result saved to new object.
Filtered 2238 features, leaving 88 of the original 2326 features. Filtering result saved to new object.
Filtered 2246 features, leaving 80 of the original 2326 features. Filtering result saved to new object.
Filtered 2252 features, leaving 74 of the original 2326 features. Filtering result saved to new object.
Filtered 2286 features, leaving 40 of the original 2326 features. Filtering result saved to new object.
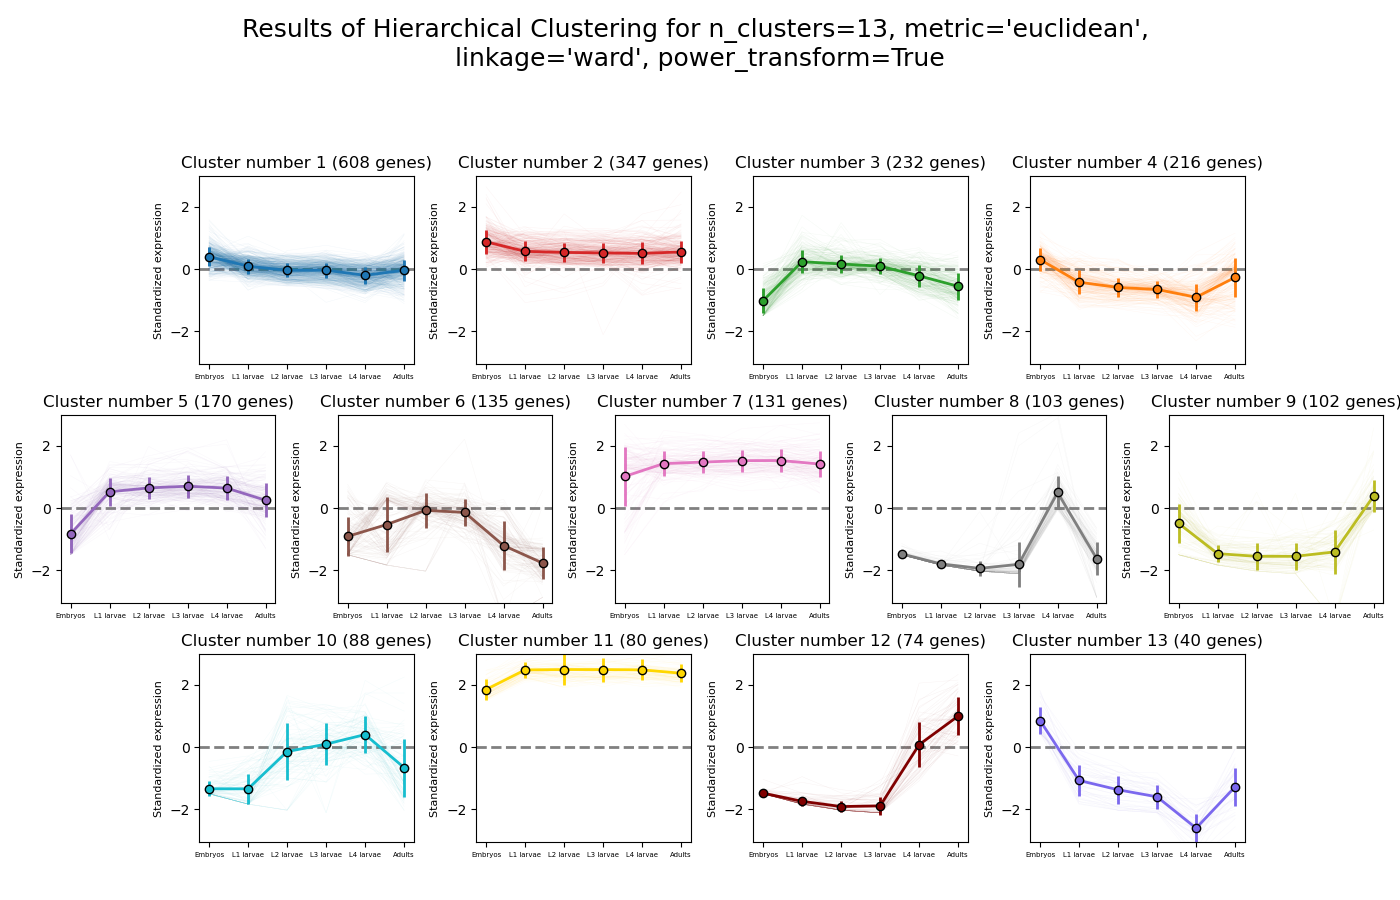
Example plot of split_hierarchical(plot_style=’all’)
- align:
center
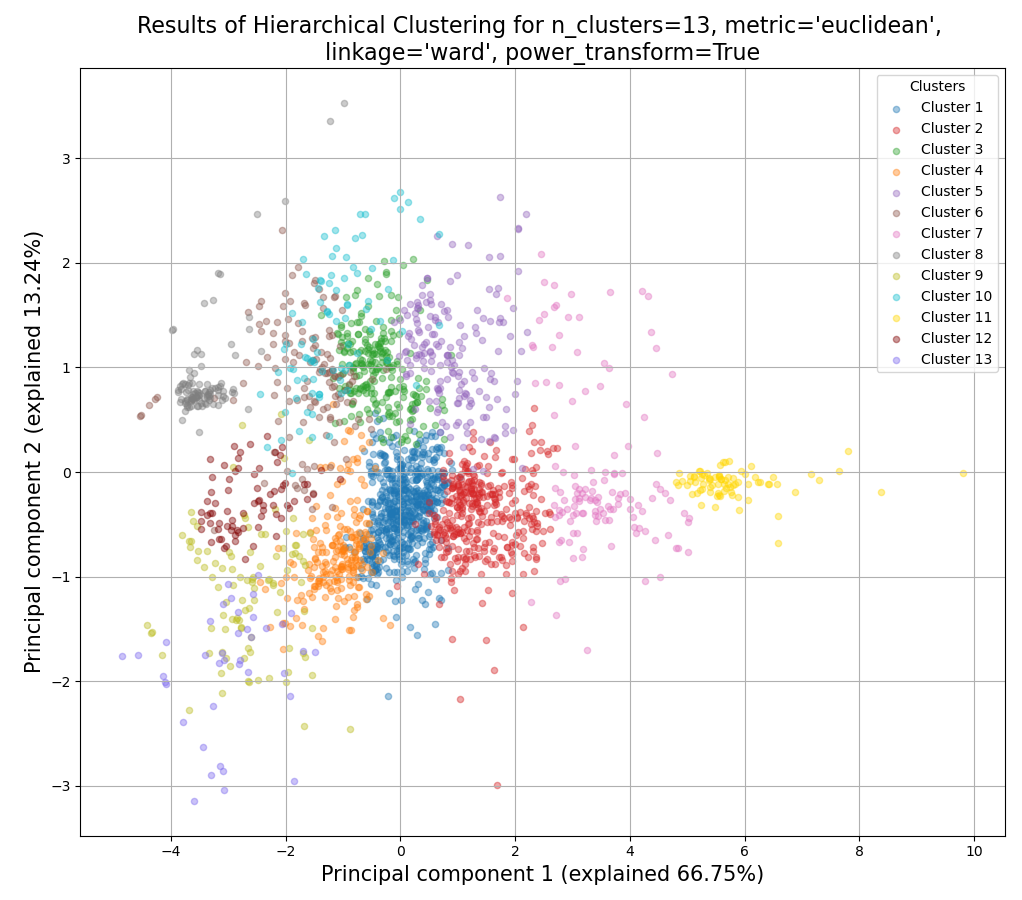
Example plot of split_hierarchical()