RNAlysis quick-start video guide
Launching RNAlysis
Open the graphical user interface by running rnalysis-gui in your terminal or executing gui.run_gui() in a Python console.
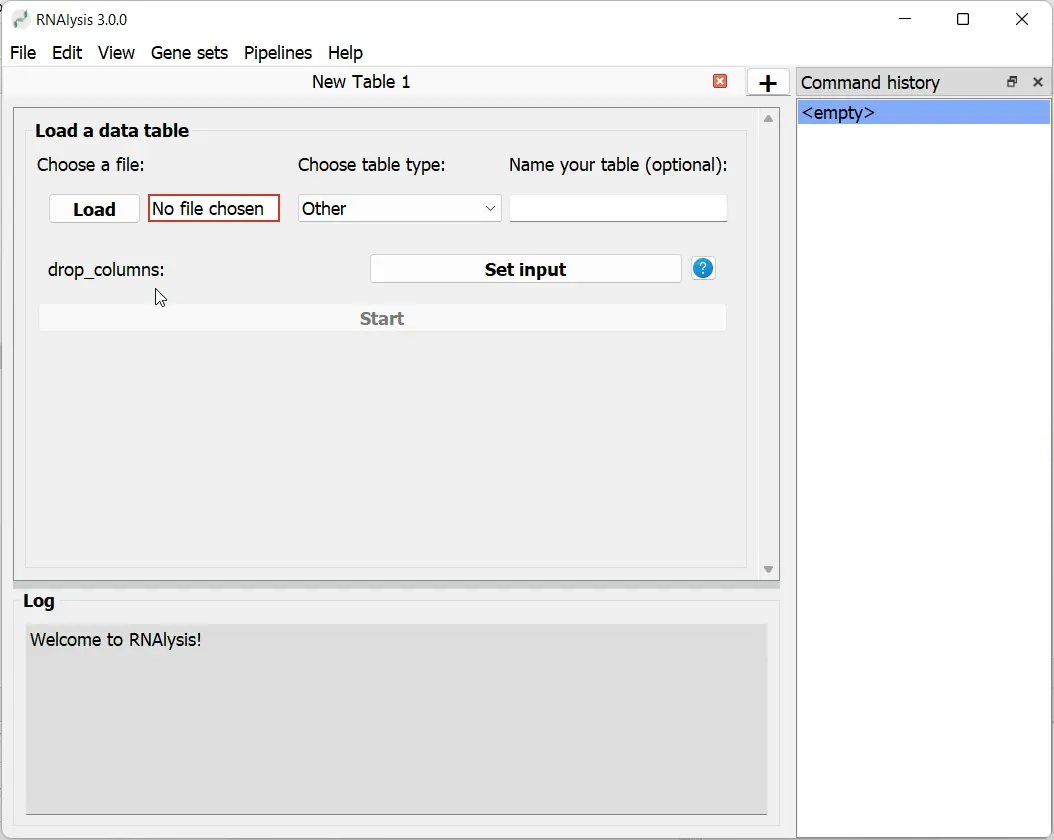
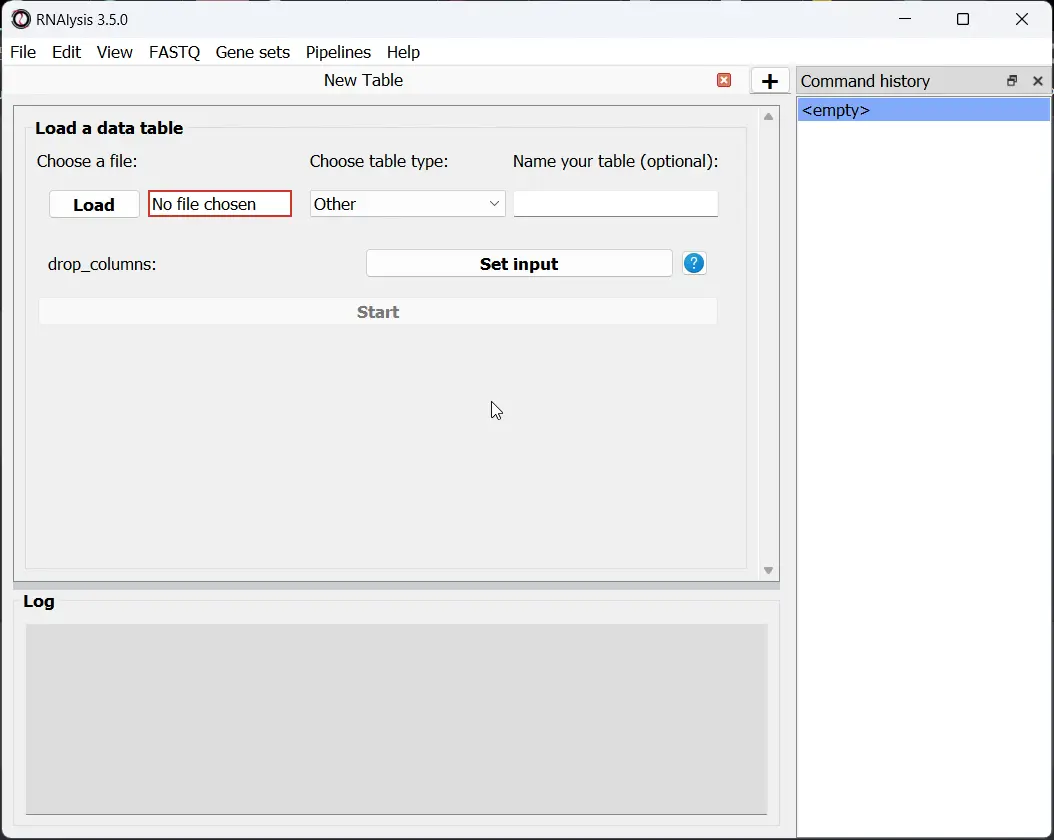
Importing Data
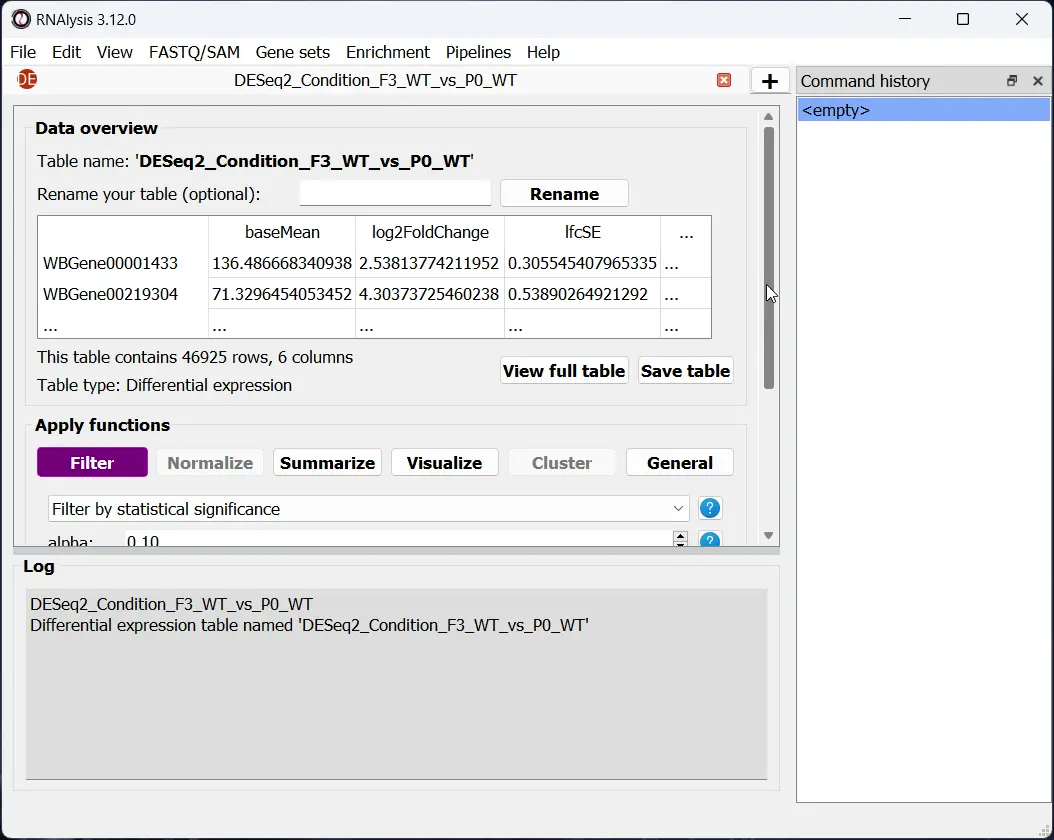
Select a file from your computer and click ‘Start’ to import it into RNAlysis.
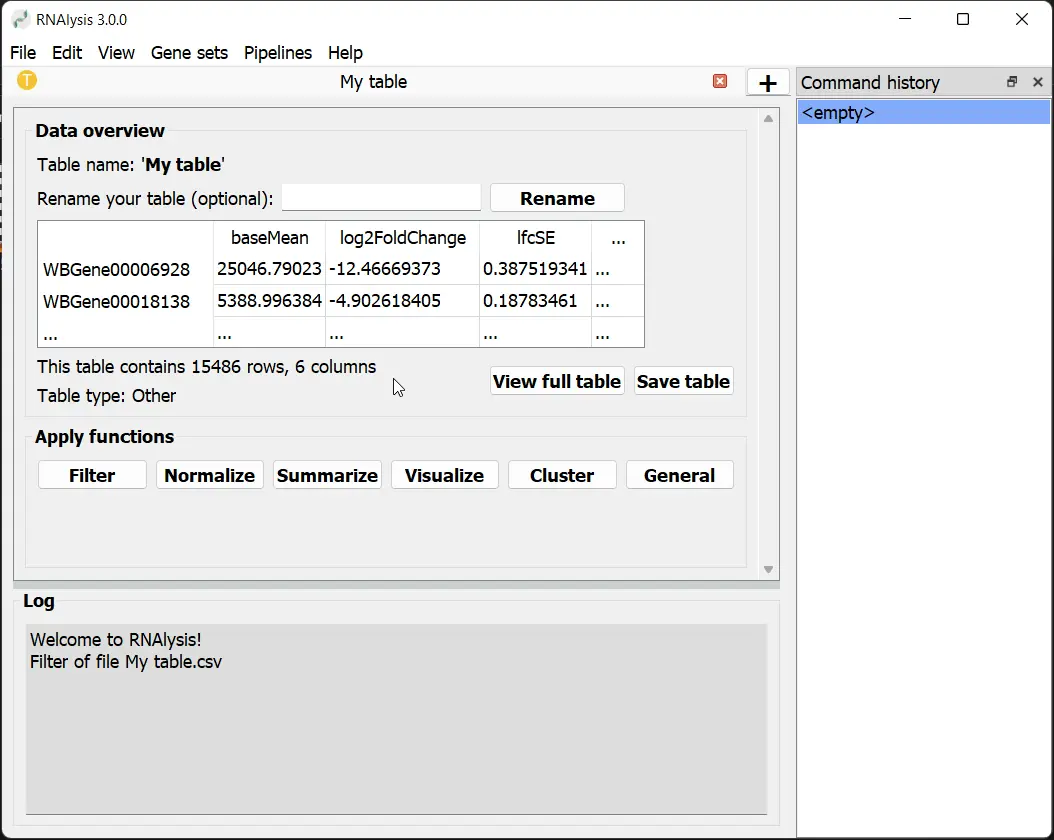
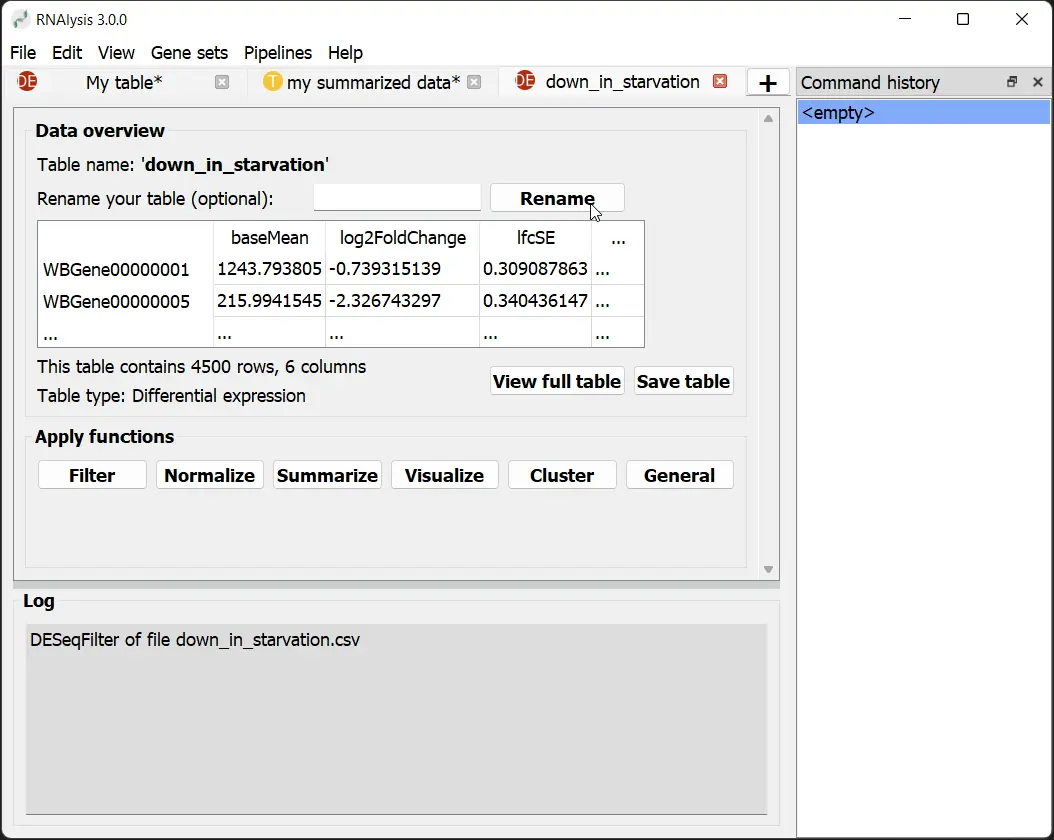
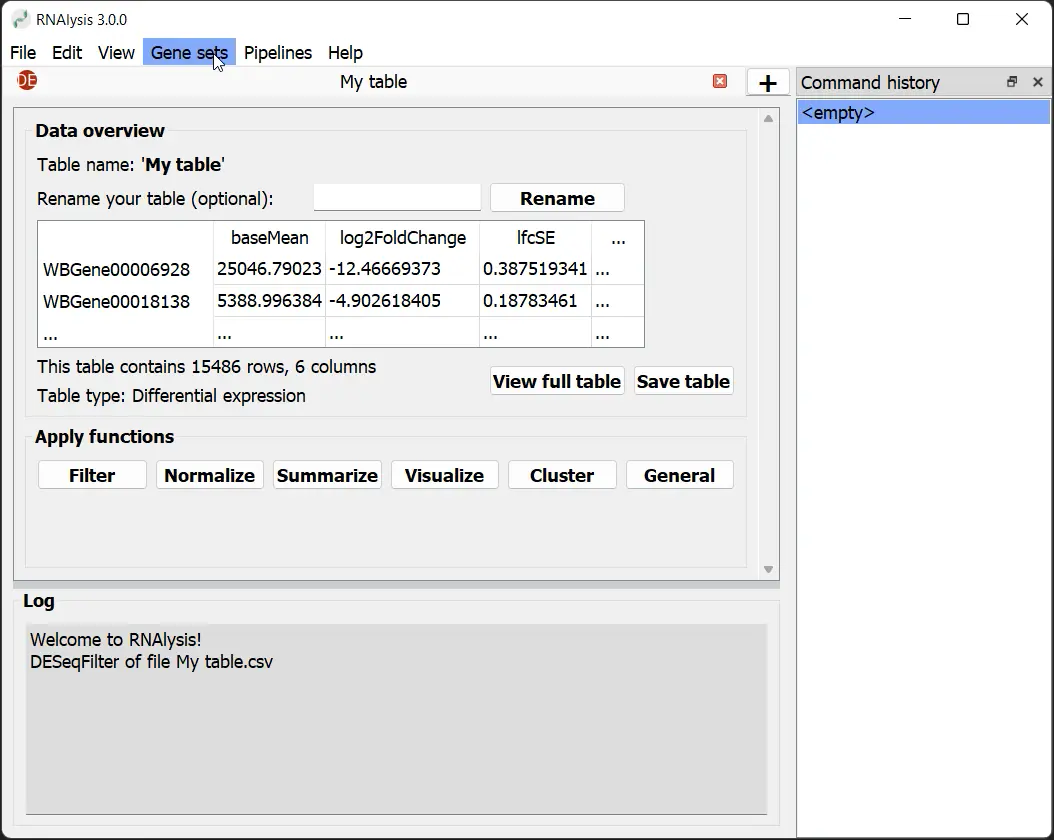
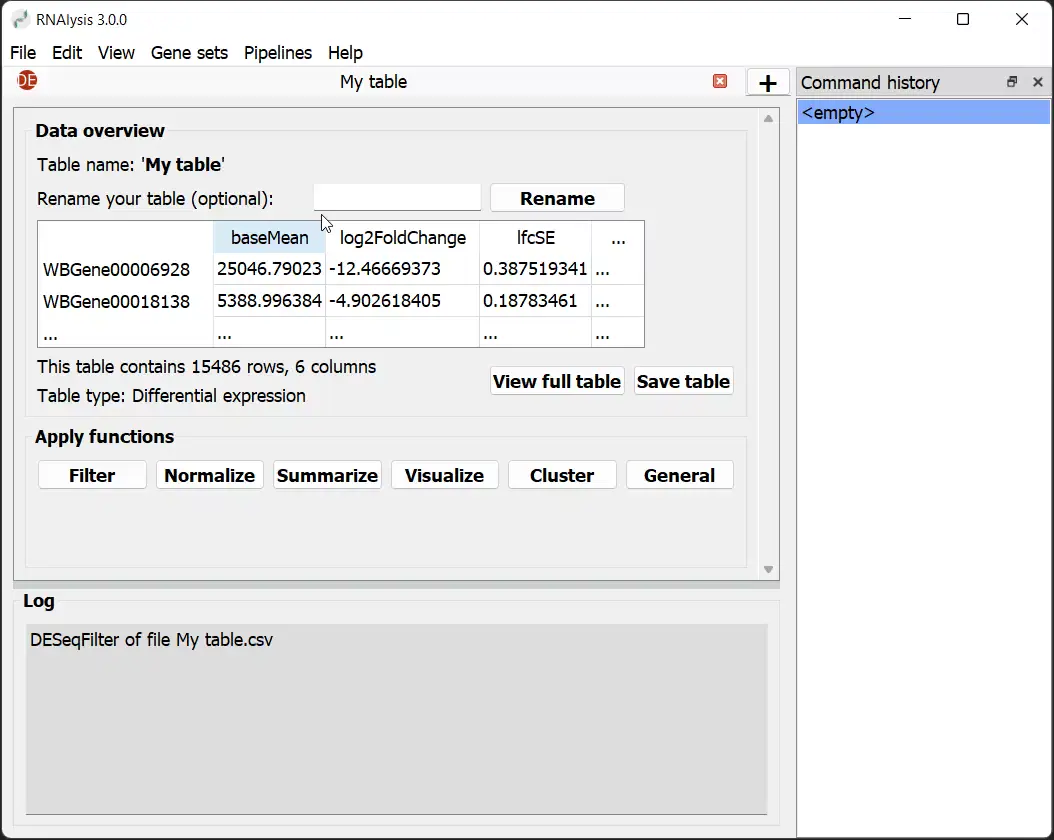
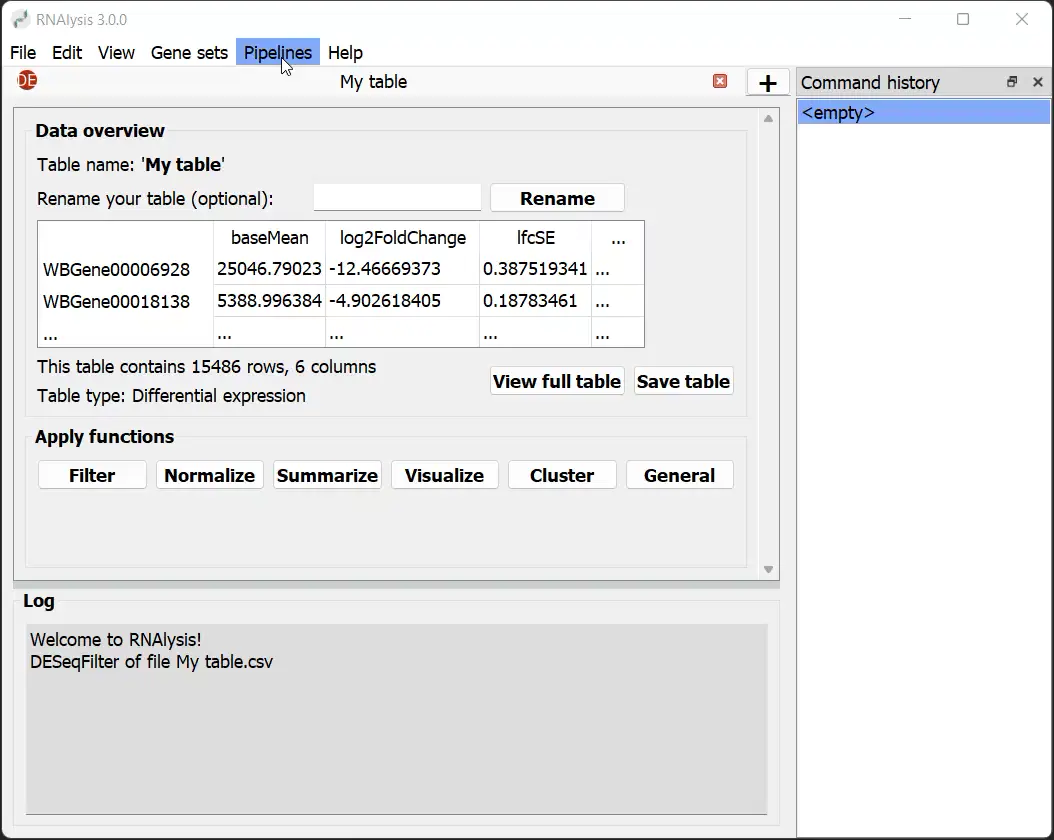
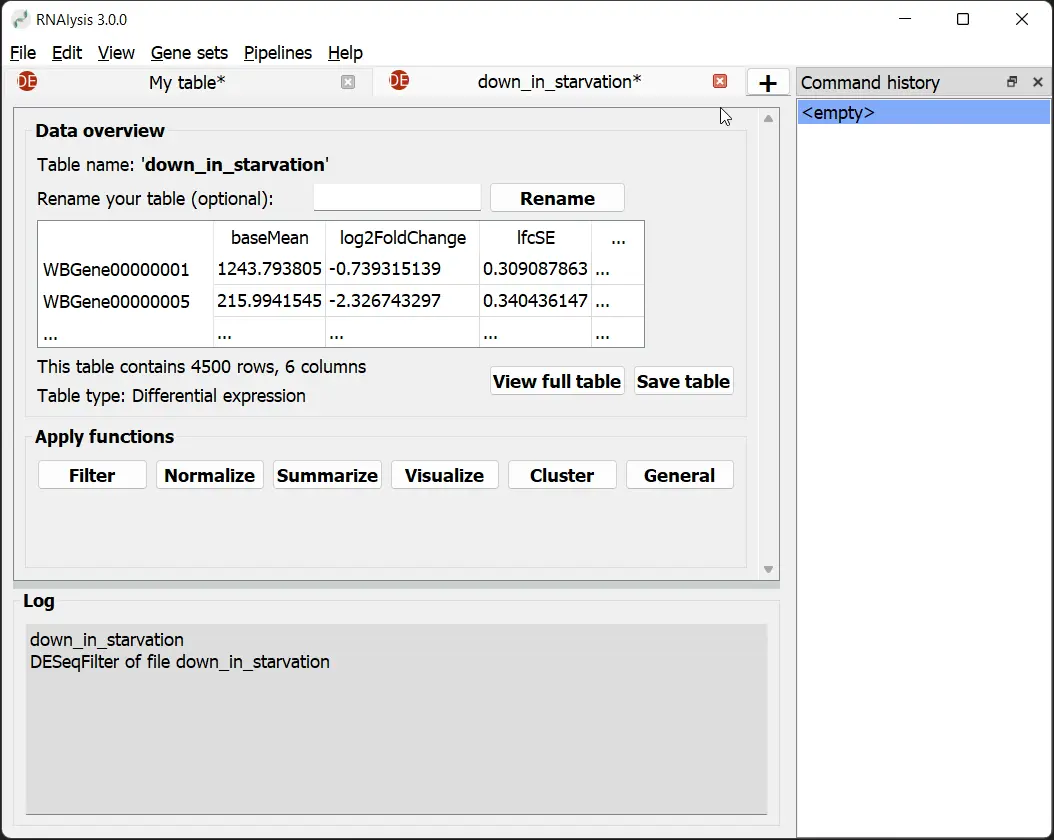
Exploring Your Dataset
View an overview of your data, including table name, type, and dimensions. Use the ‘View full table’ button for a comprehensive look.
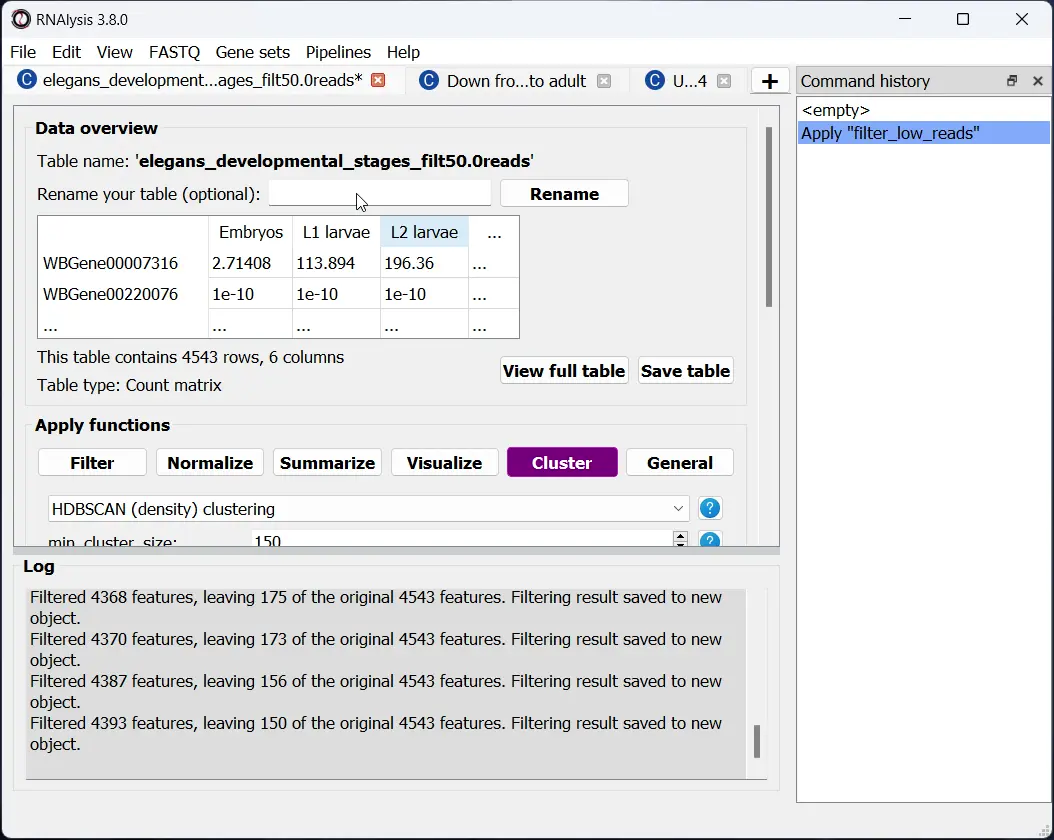
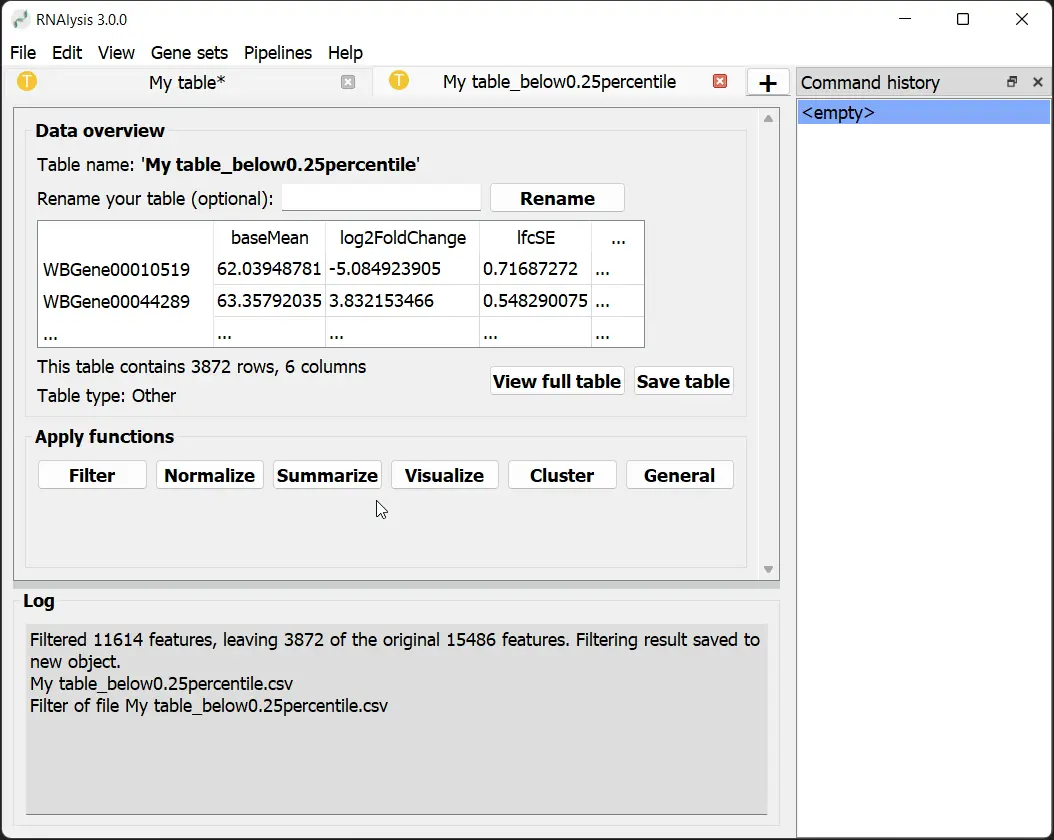
Applying Filters
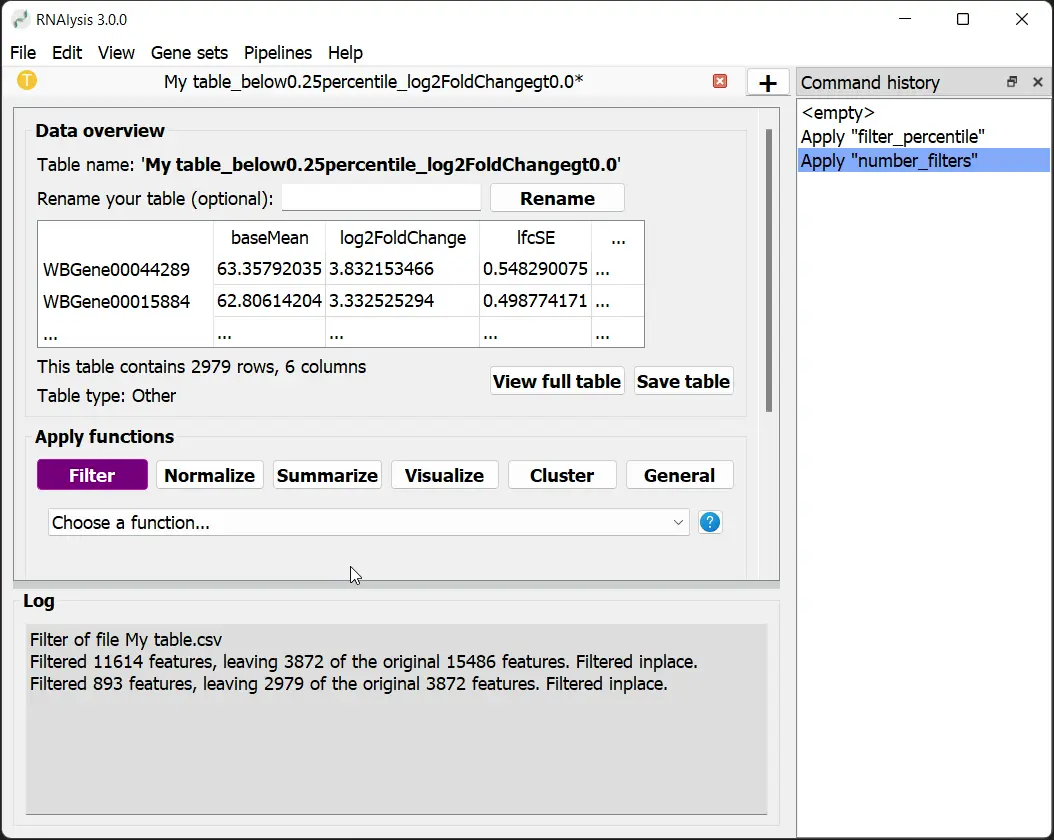
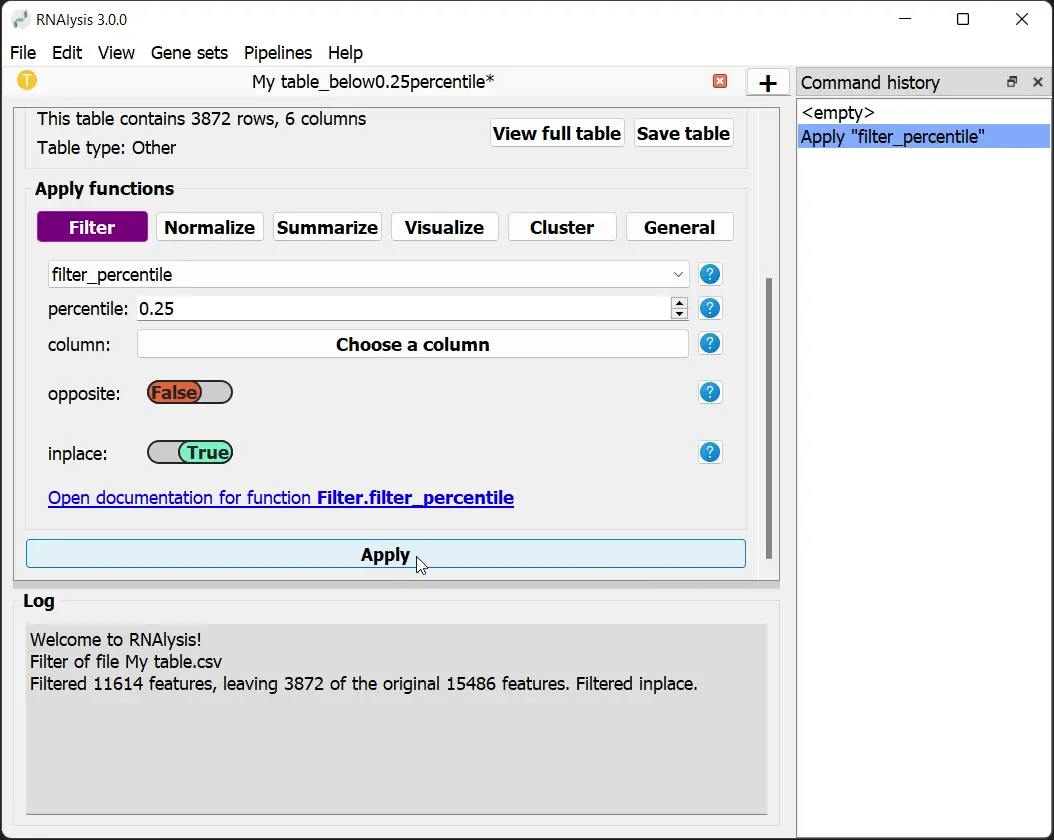
Select a filtering function, adjust parameters, and click ‘Apply’ to modify your table. Changes won’t affect the original file until saved.
Undo the operations you applied to your data
Use the ‘Command history’ window to undo or redo operations applied to your table at any time.
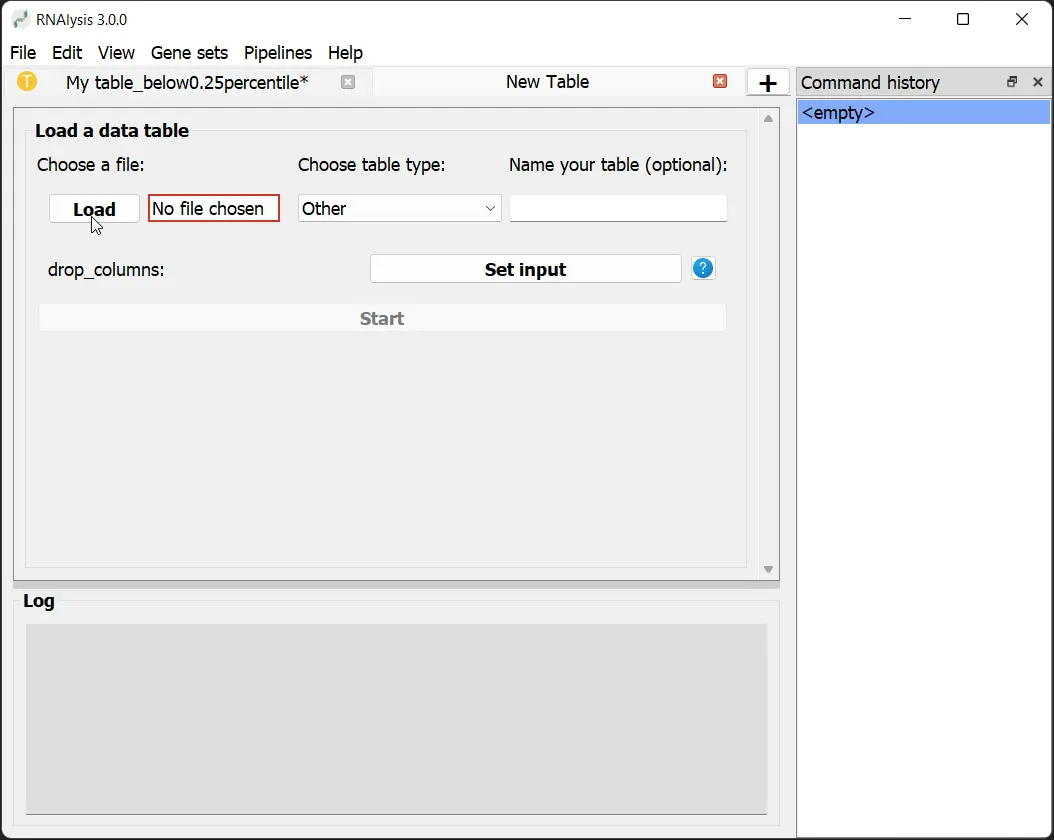
Apply your operations ‘in-place’ or make a copy
Apply operations ‘in-place’ or to a copy of your table in a new tab, leaving the original unmodified.
Generating and Saving Visualizations
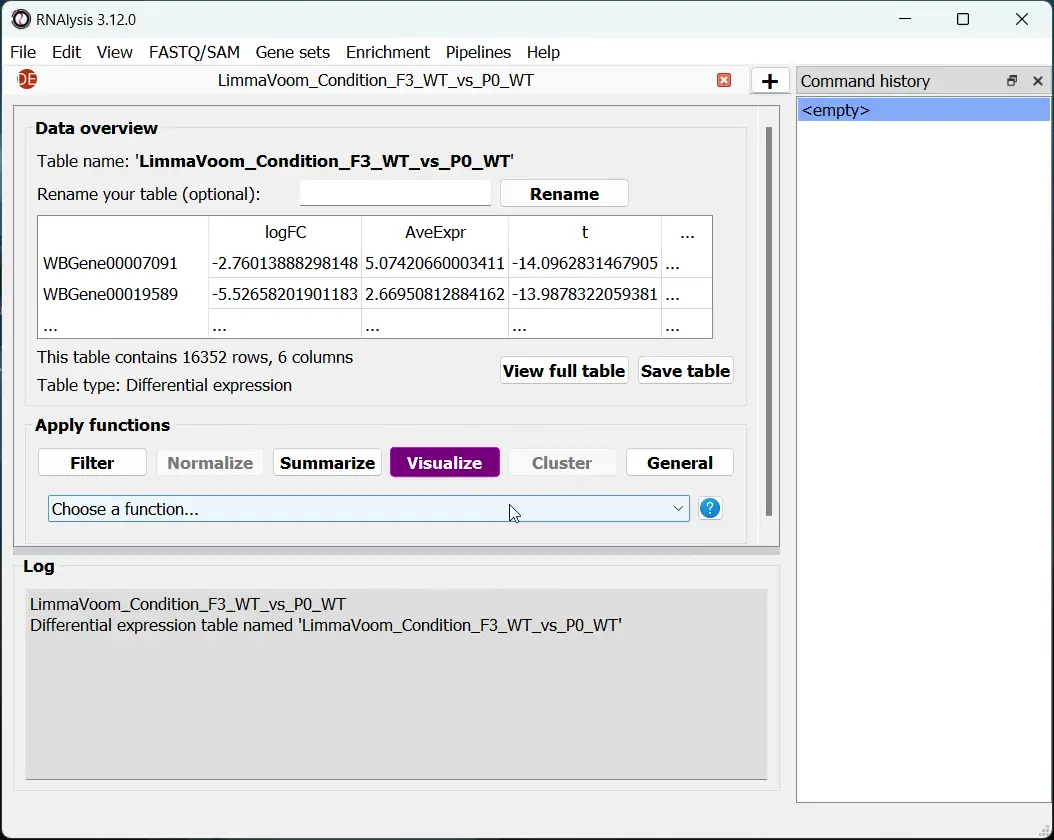
Create graphs of your data, resize them, and save in various file formats for further use or presentation.
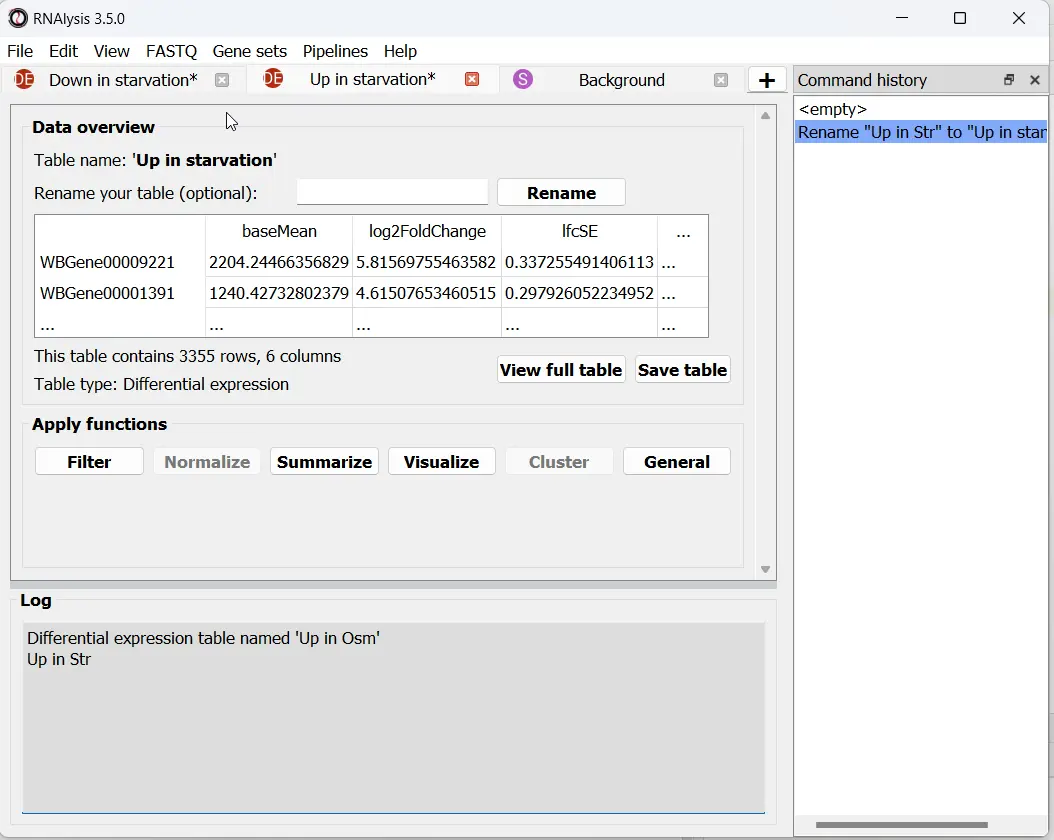
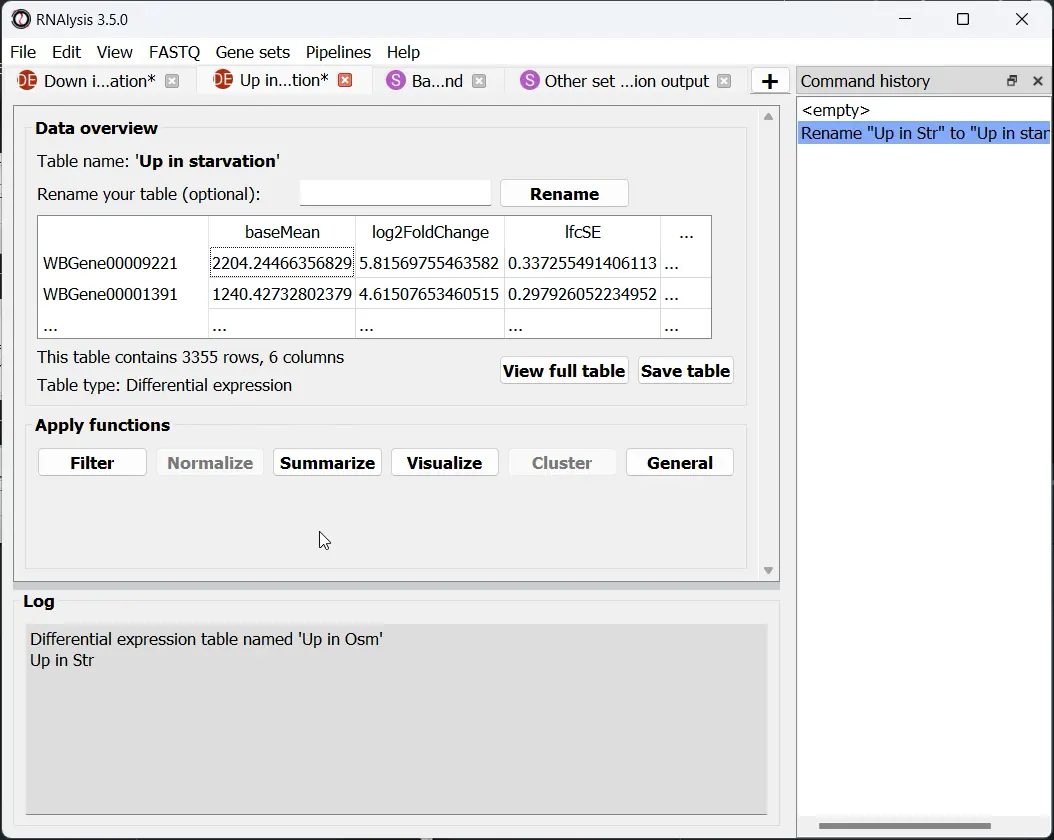
Analyze Multiple Tables at the Same Time
Open new tabs to work on multiple tables simultaneously, enhancing your analytical capabilities.
Organizing Your Workspace
Sort tabs and customize their colors to efficiently manage your analytical workspace.
Saving Modified Tables
Click ‘Save table’ to store the results of your filtering operations in a location of your choice.
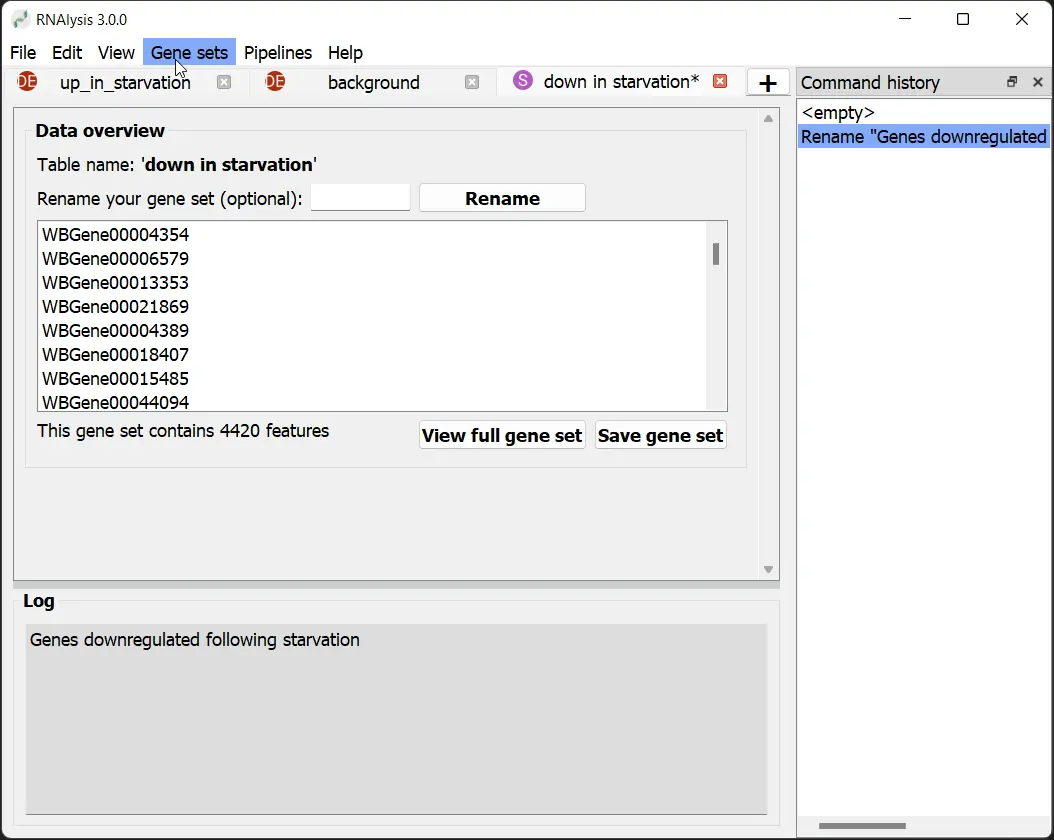
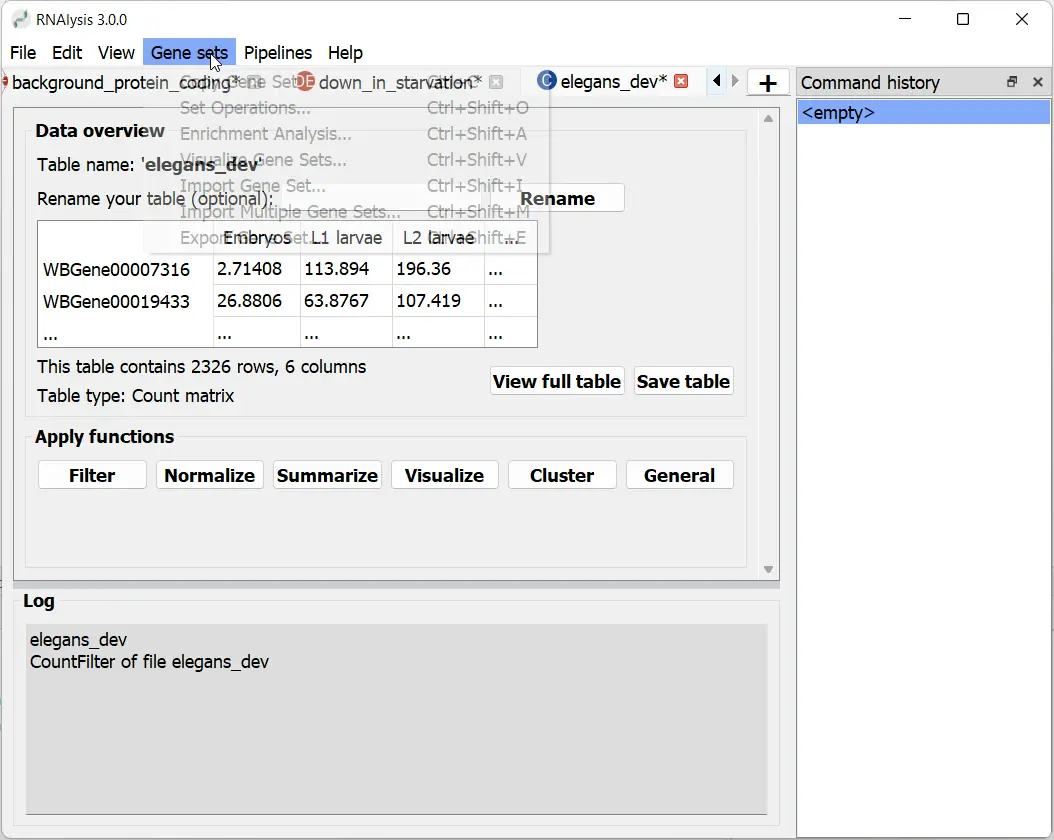
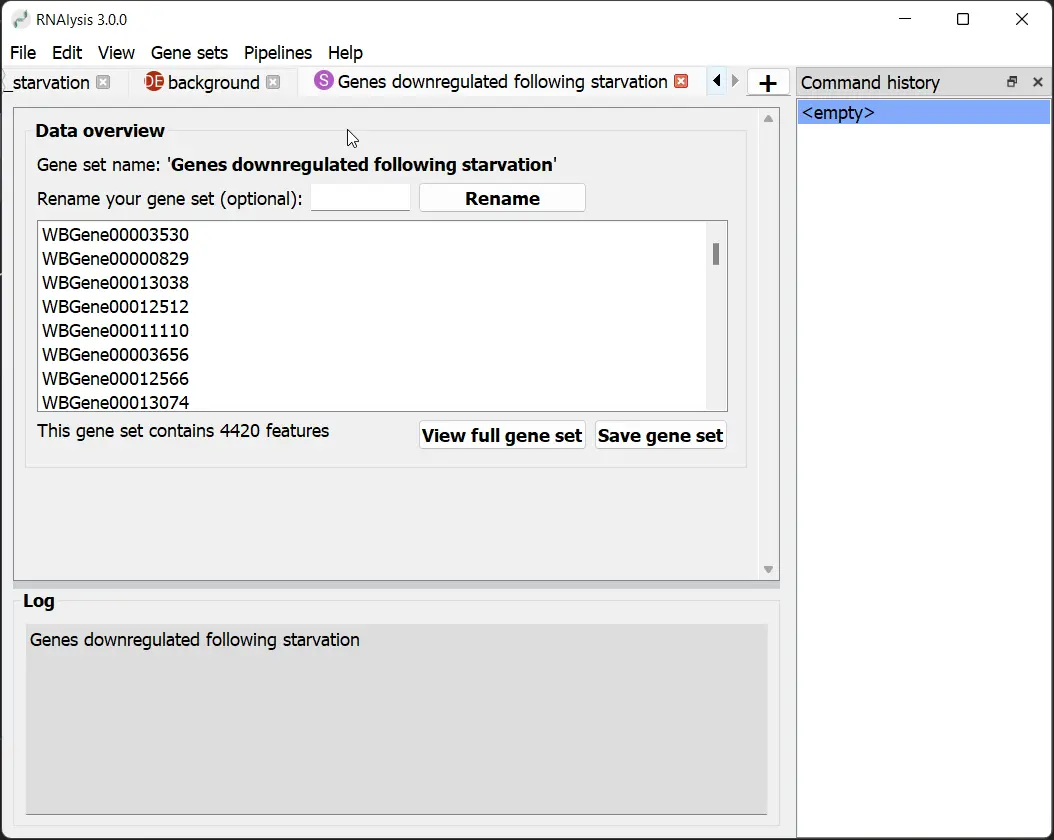
Creating Gene Sets
Import lists of genes as Gene Sets for specialized analysis within RNAlysis.
Visualizing Gene Set Intersections
Use the ‘Visualize Gene Sets’ window to create Venn diagrams and UpSet plots, illustrating intersections between tables and gene sets.
Performing Set Operations
Extract specific subsets from your data using predefined set operations or by selecting subsets in the preview pane.
Conducting Enrichment Analysis
Perform various types of enrichment analysis on your filtered tables and gene sets to gain biological insights.
Rapid Gene Information Lookup
Right-click to quickly access gene information from various biological databases, customizable in the settings menu.
Building Analysis Pipelines
Group multiple operations with specific parameters into a Pipeline to streamline your data analysis workflow.
Executing Pipelines
Apply Pipelines to multiple tables simultaneously, enhancing efficiency and reducing errors in your analysis.
Sharing and Reproducing Analyses
Export and share Pipelines to facilitate reproducibility and collaborative analysis across different computers.
Integrating External Bioinformatic Tools
Access a graphical interface for various bioinformatic tools, covering stages from adapter trimming to differential expression analysis.
Leveraging Table-Specific Functions
Specify table types when loading to access specialized functions, such as clustering analysis for count matrices.
Recovering Closed Tabs
Restore accidentally closed tabs through the ‘Edit’ menu to recover your work.
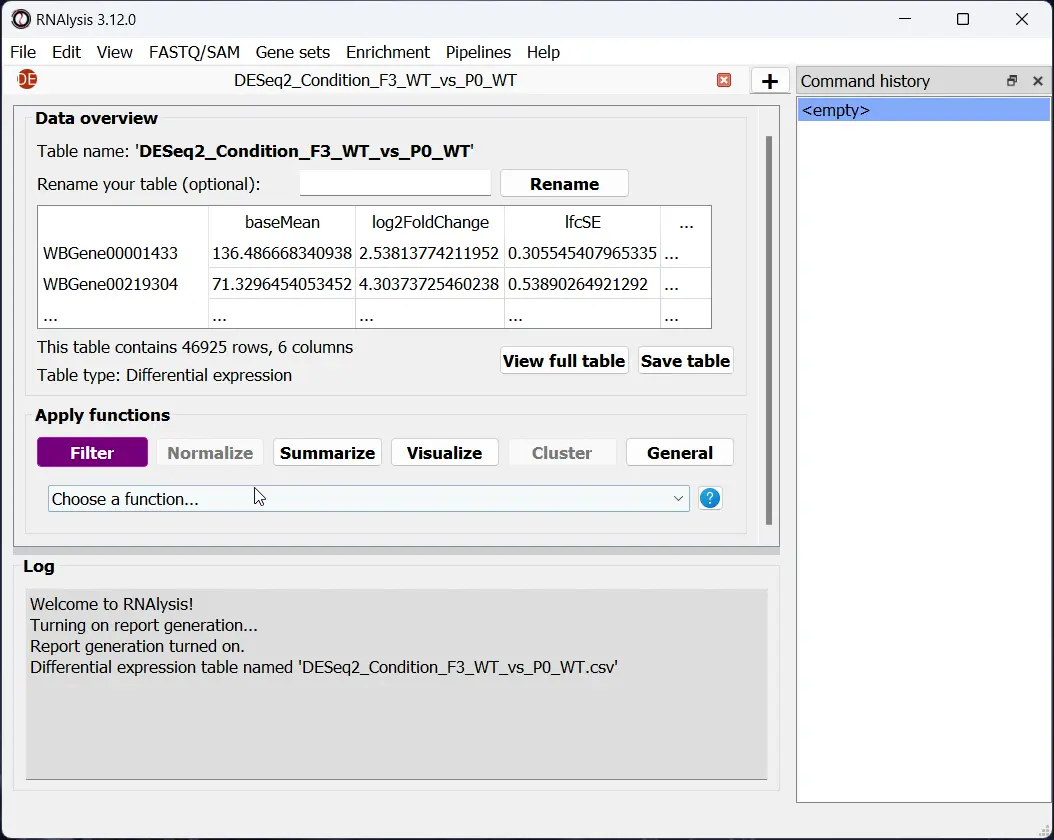
Generating Interactive Analysis Reports
Create comprehensive, interactive analysis reports with a single click, automatically including all generated tables, gene sets, and graphs.