How to use the RNAlysis analysis reports
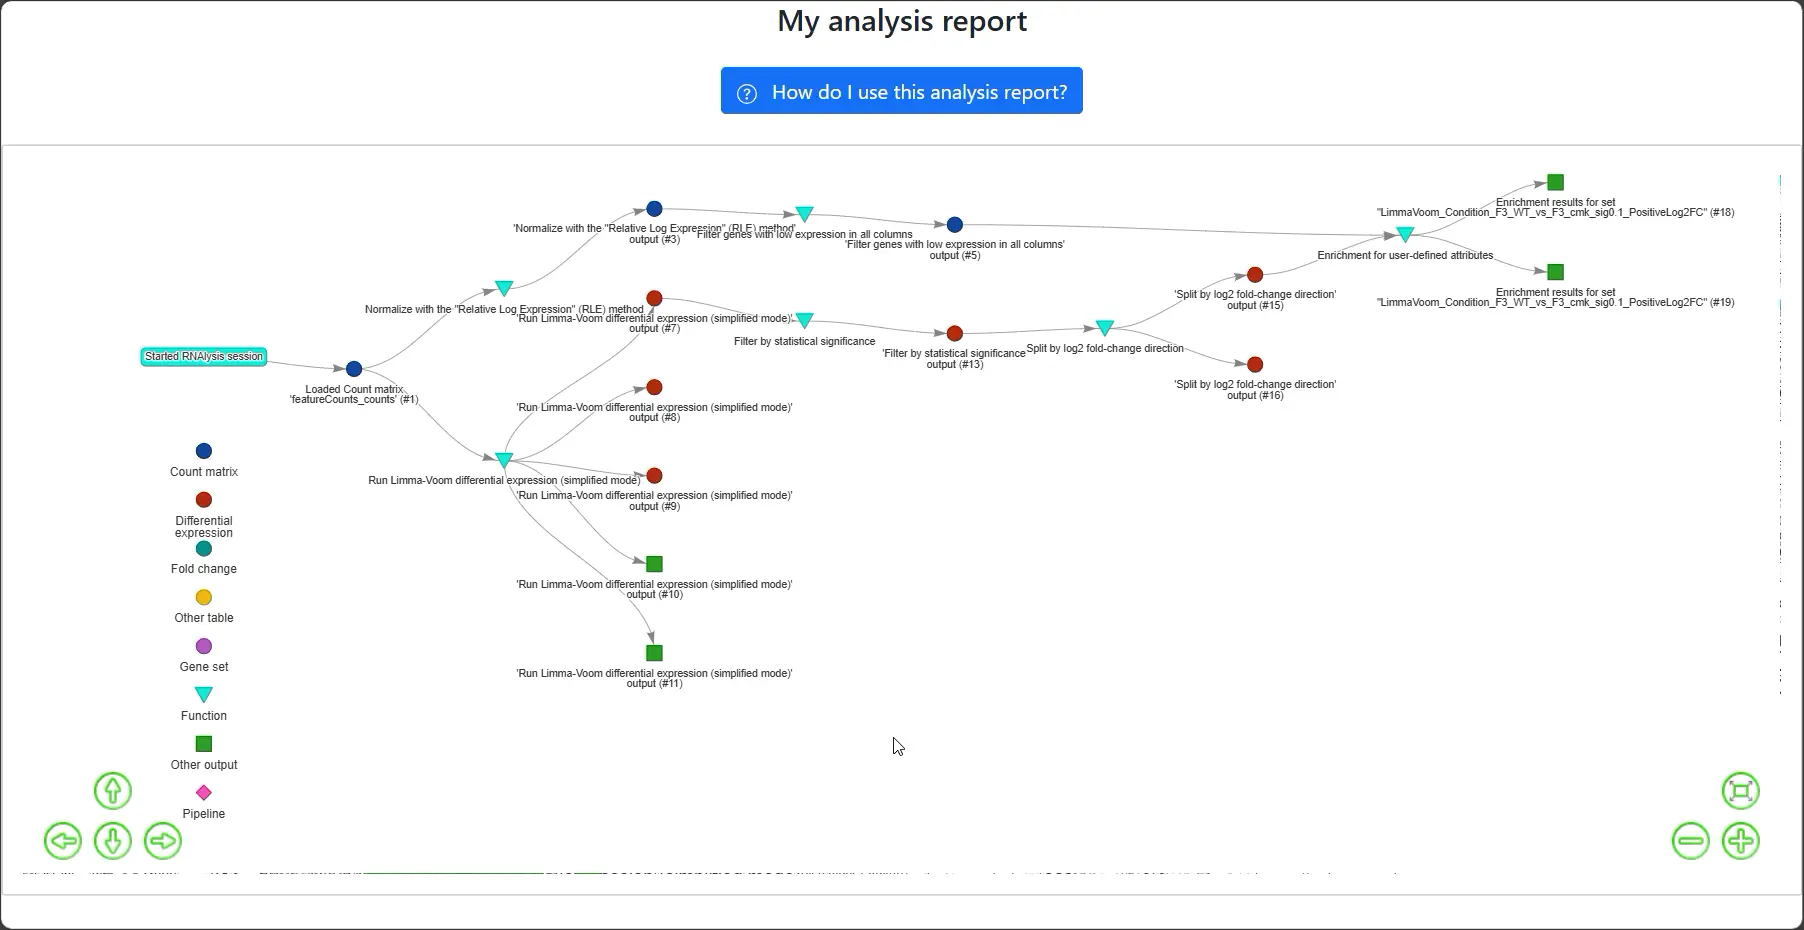
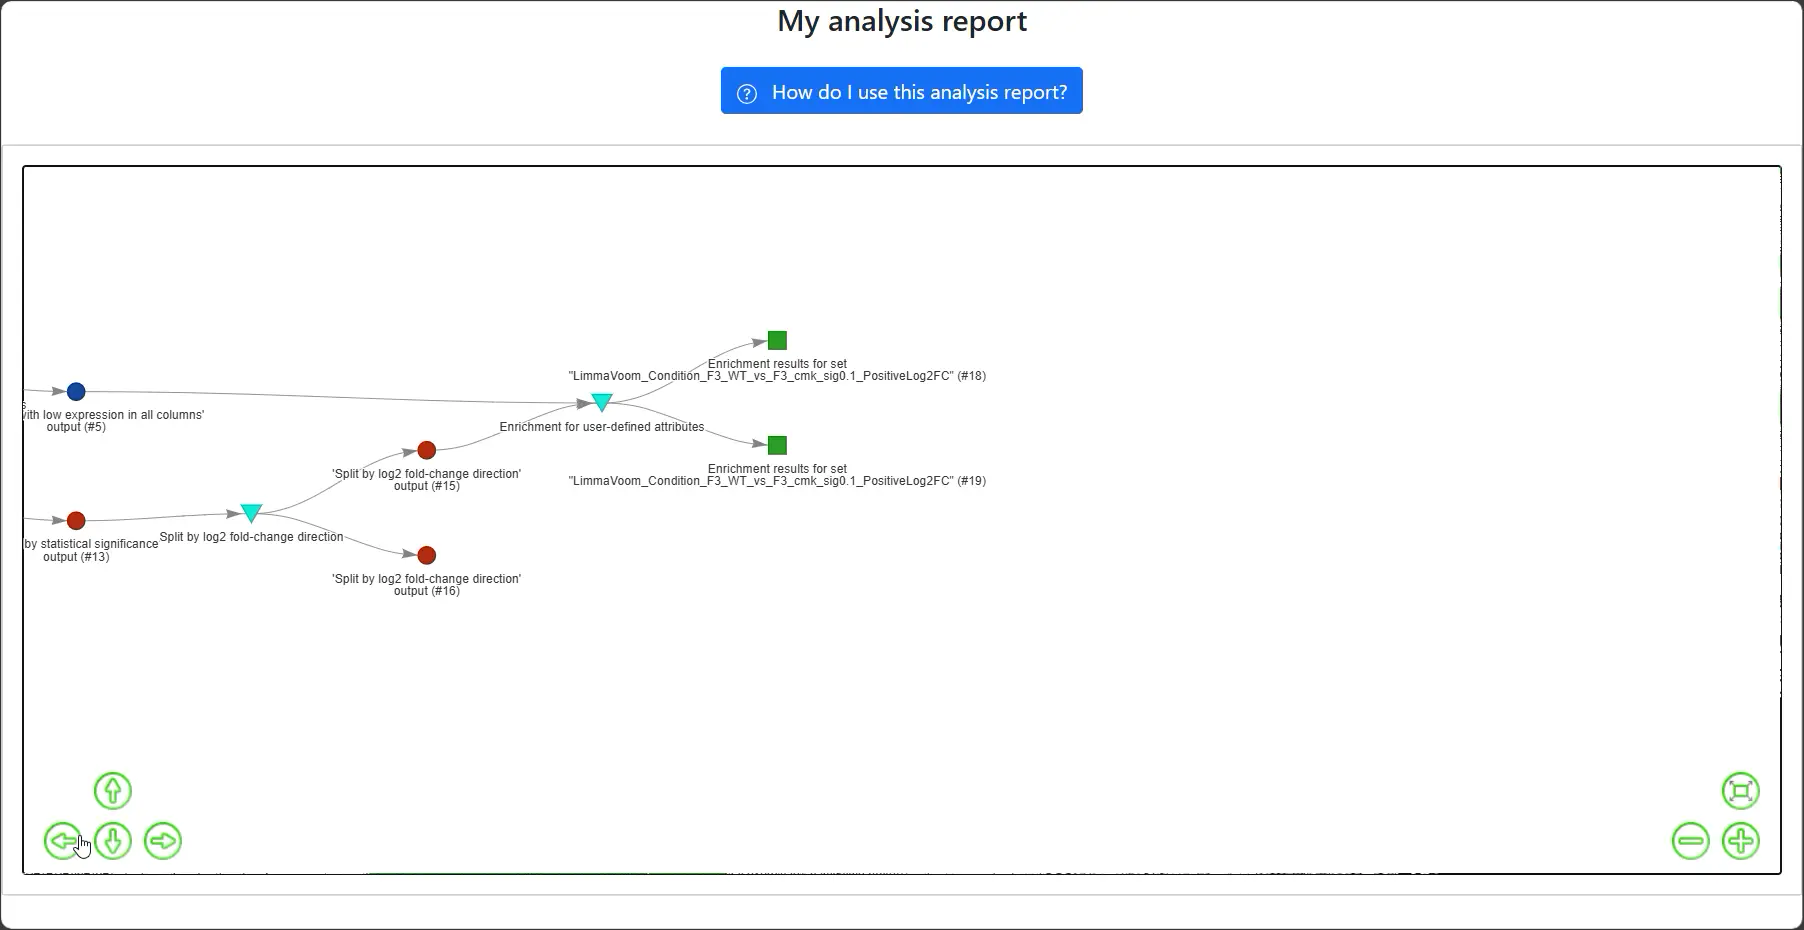
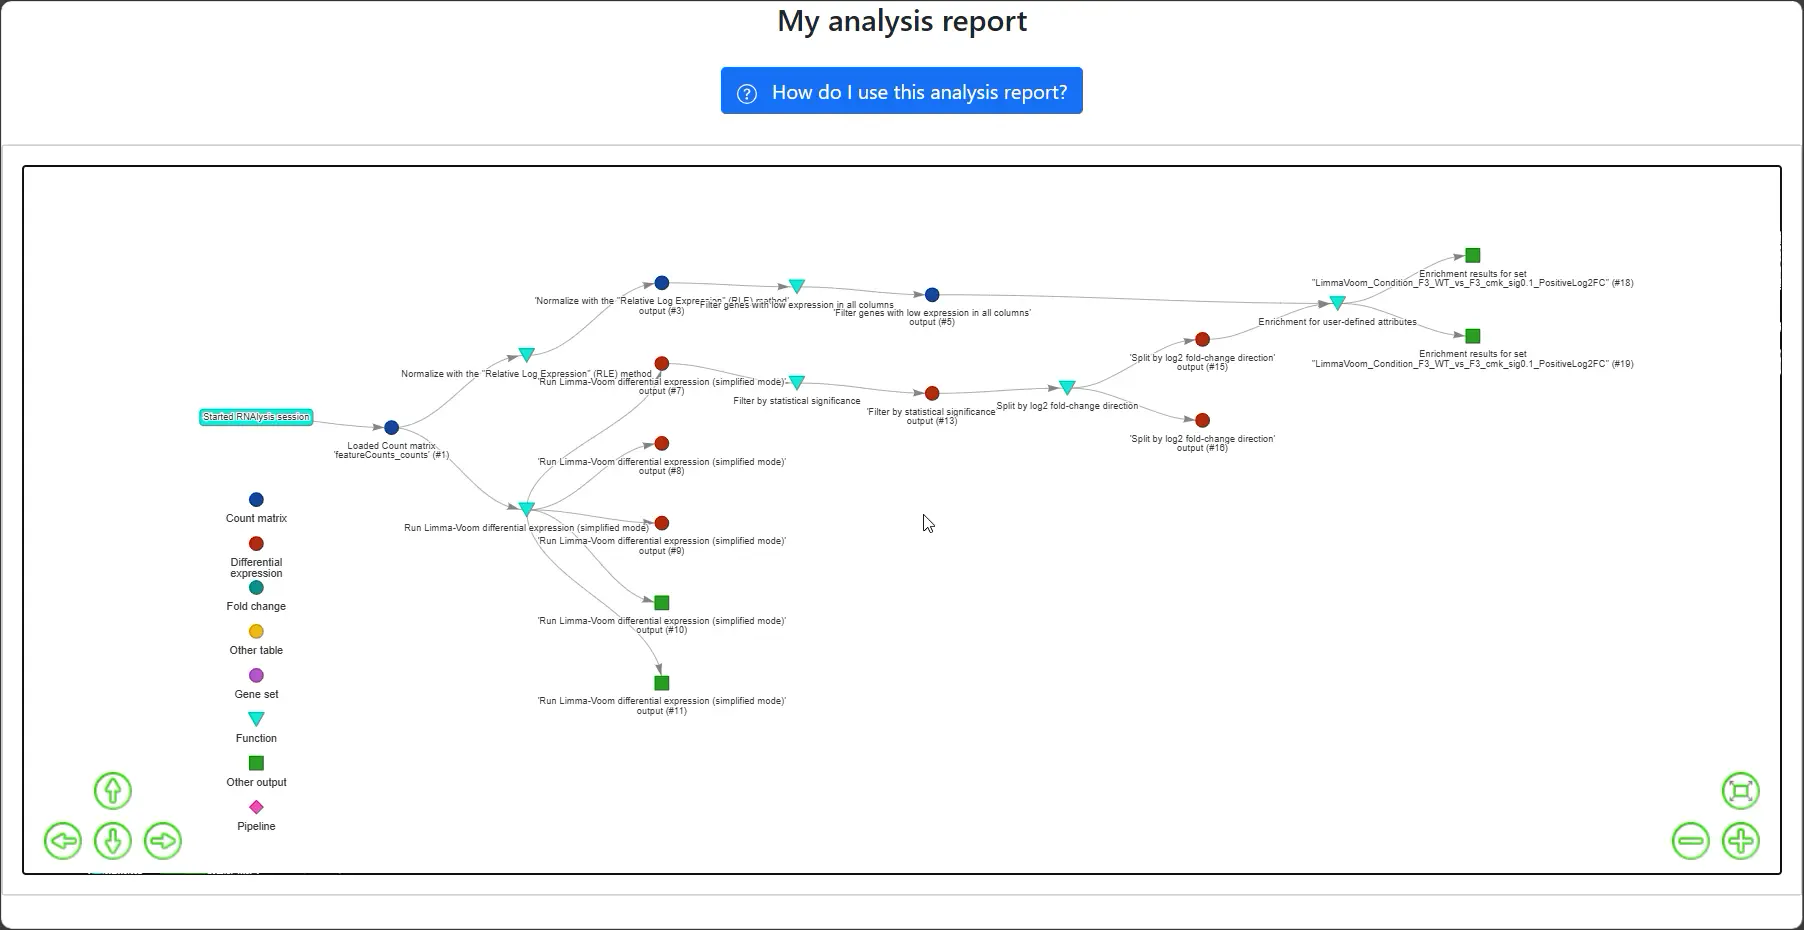
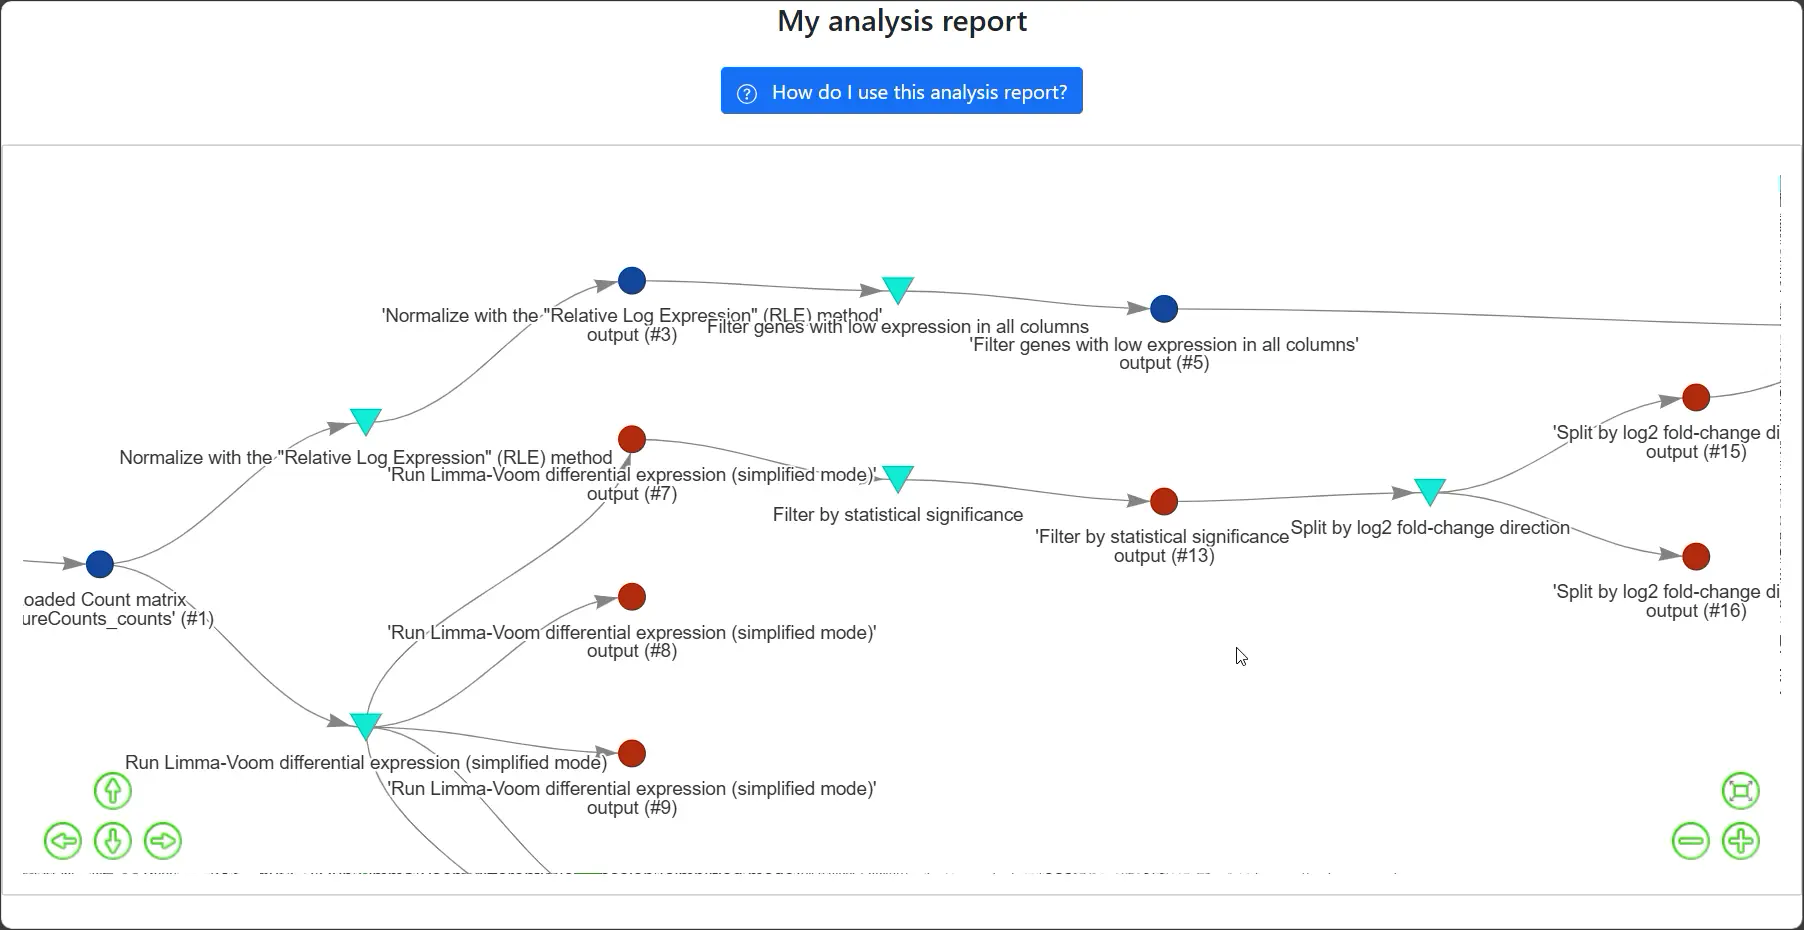
Understanding the Graph
Each node represents a data table, gene set, or function call. Arrows show the analysis workflow direction.
Node Details at a Glance
Hover over a node to see a preview and list of parameters associated with that step in the analysis.
Accessing Associated Files
Click on the link in the hover popup to open the file associated with that node.
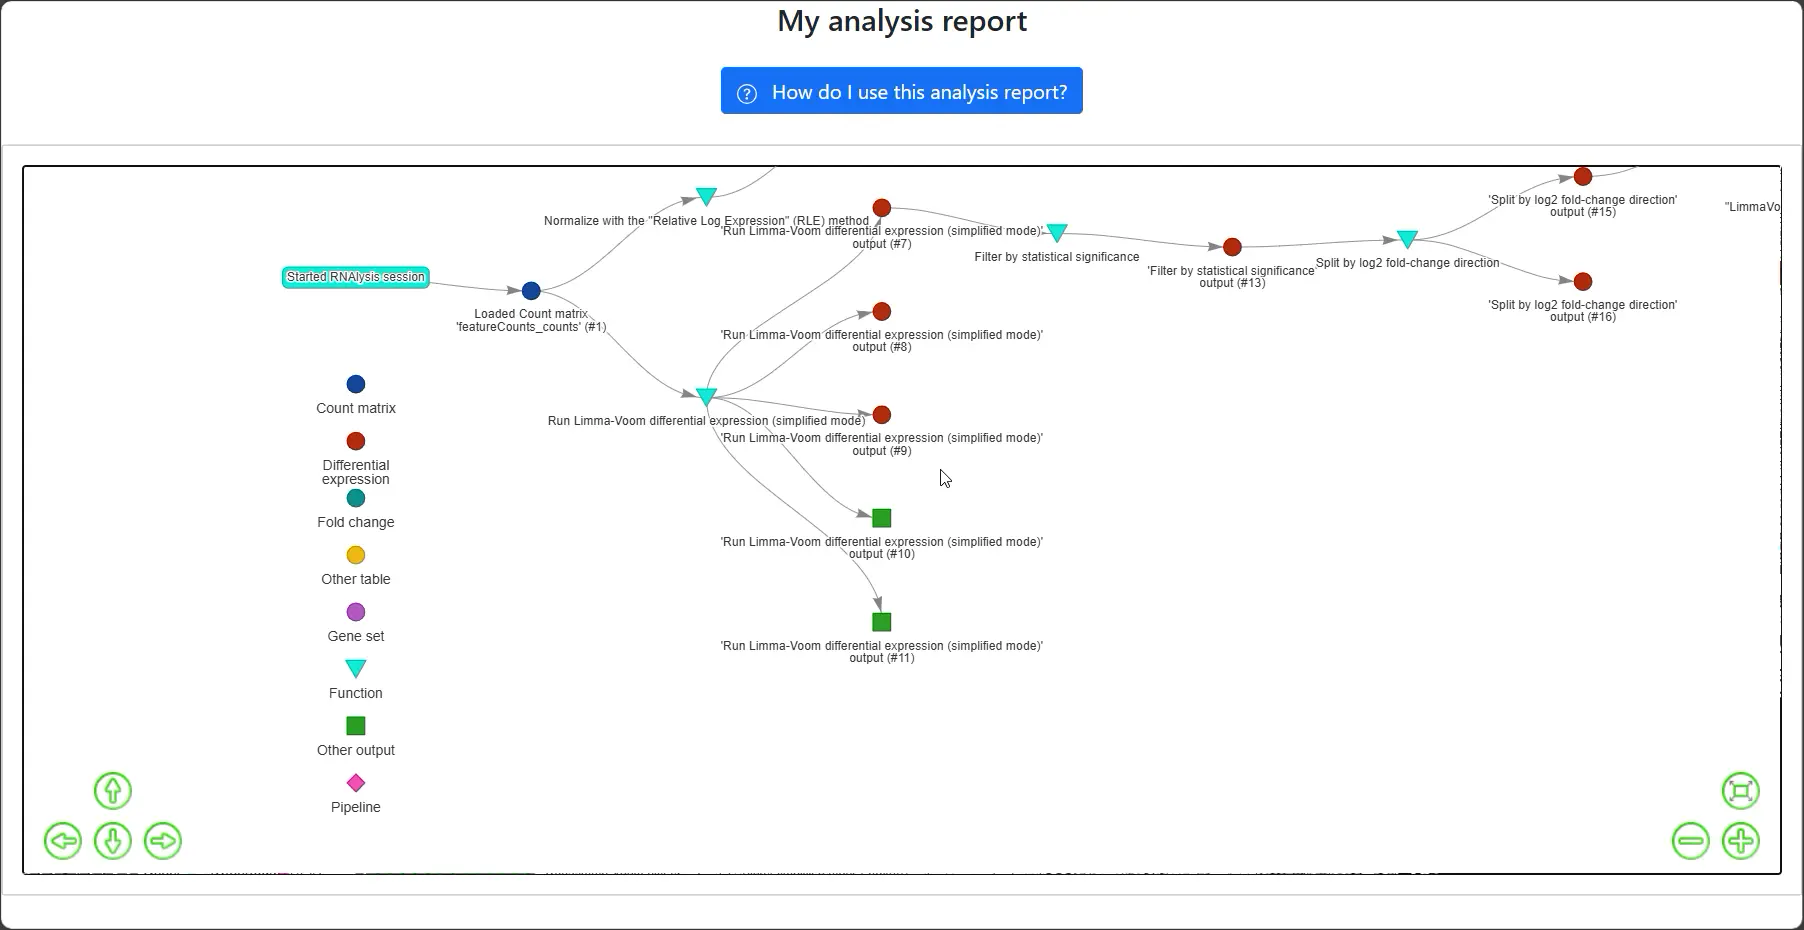
Navigating the Graph: Panning
To move around the graph, click and drag the screen, or use the arrow buttons on the bottom-left side of your screen.
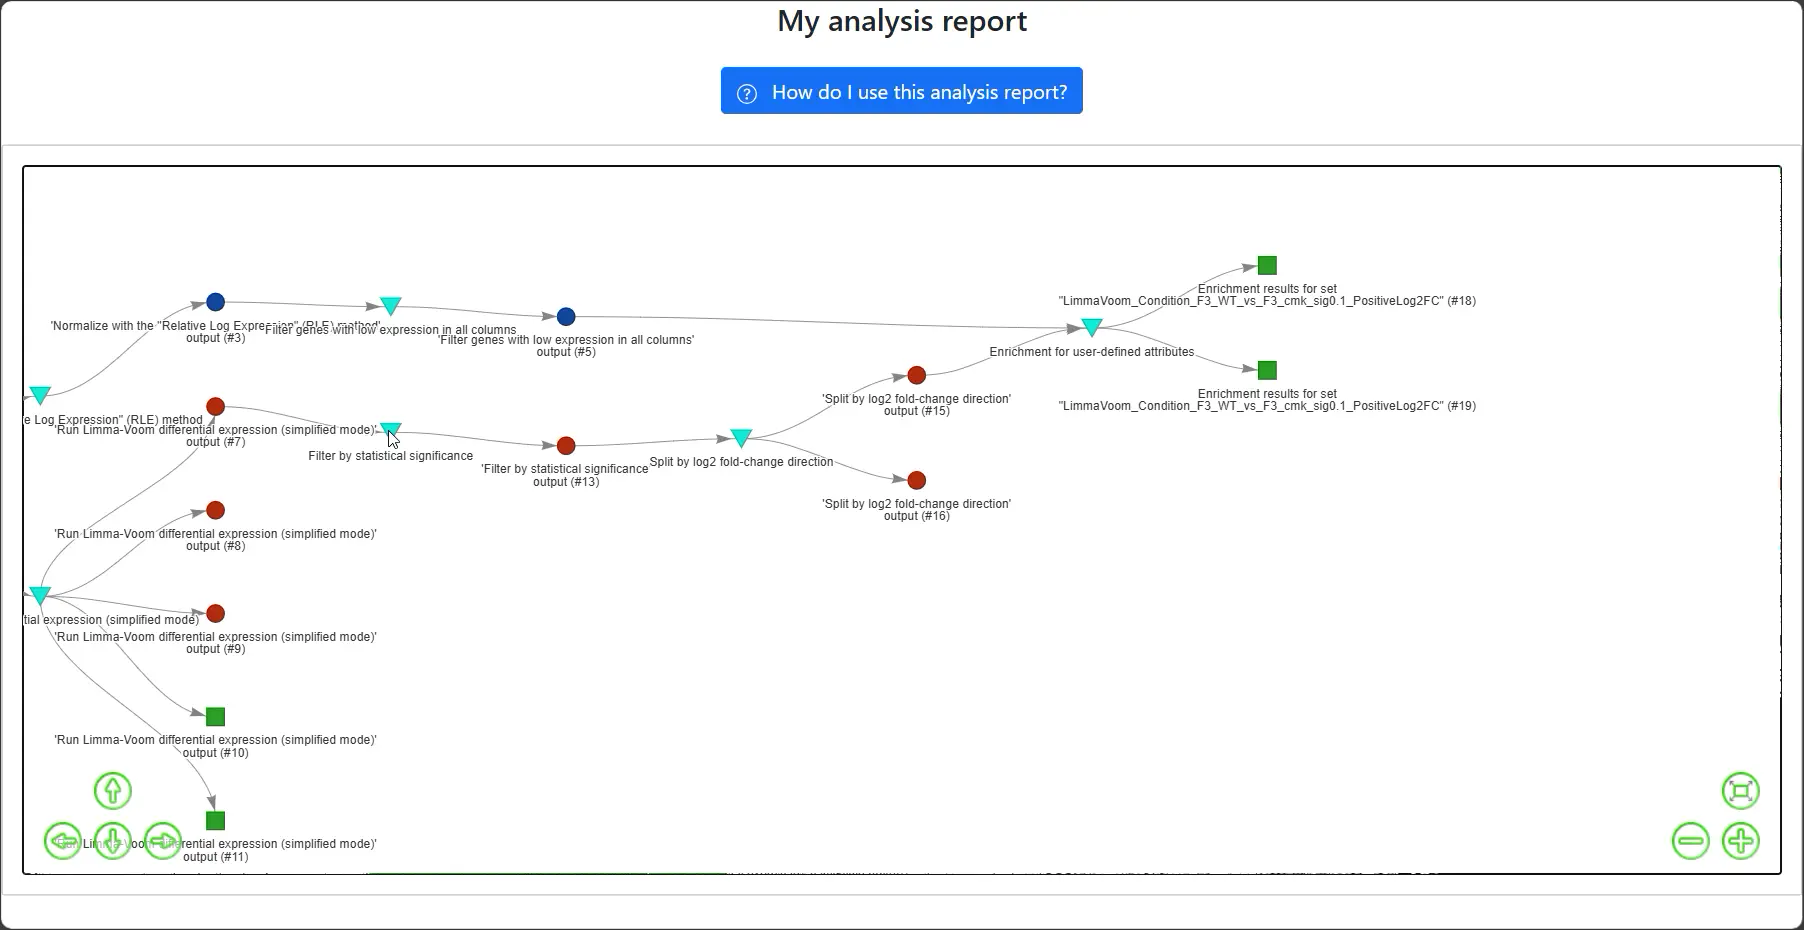
Navigating the Graph: Zooming
Use the ‘+’ and ‘-’ buttons on the bottom-right of the screen to zoom in and out of the graph.
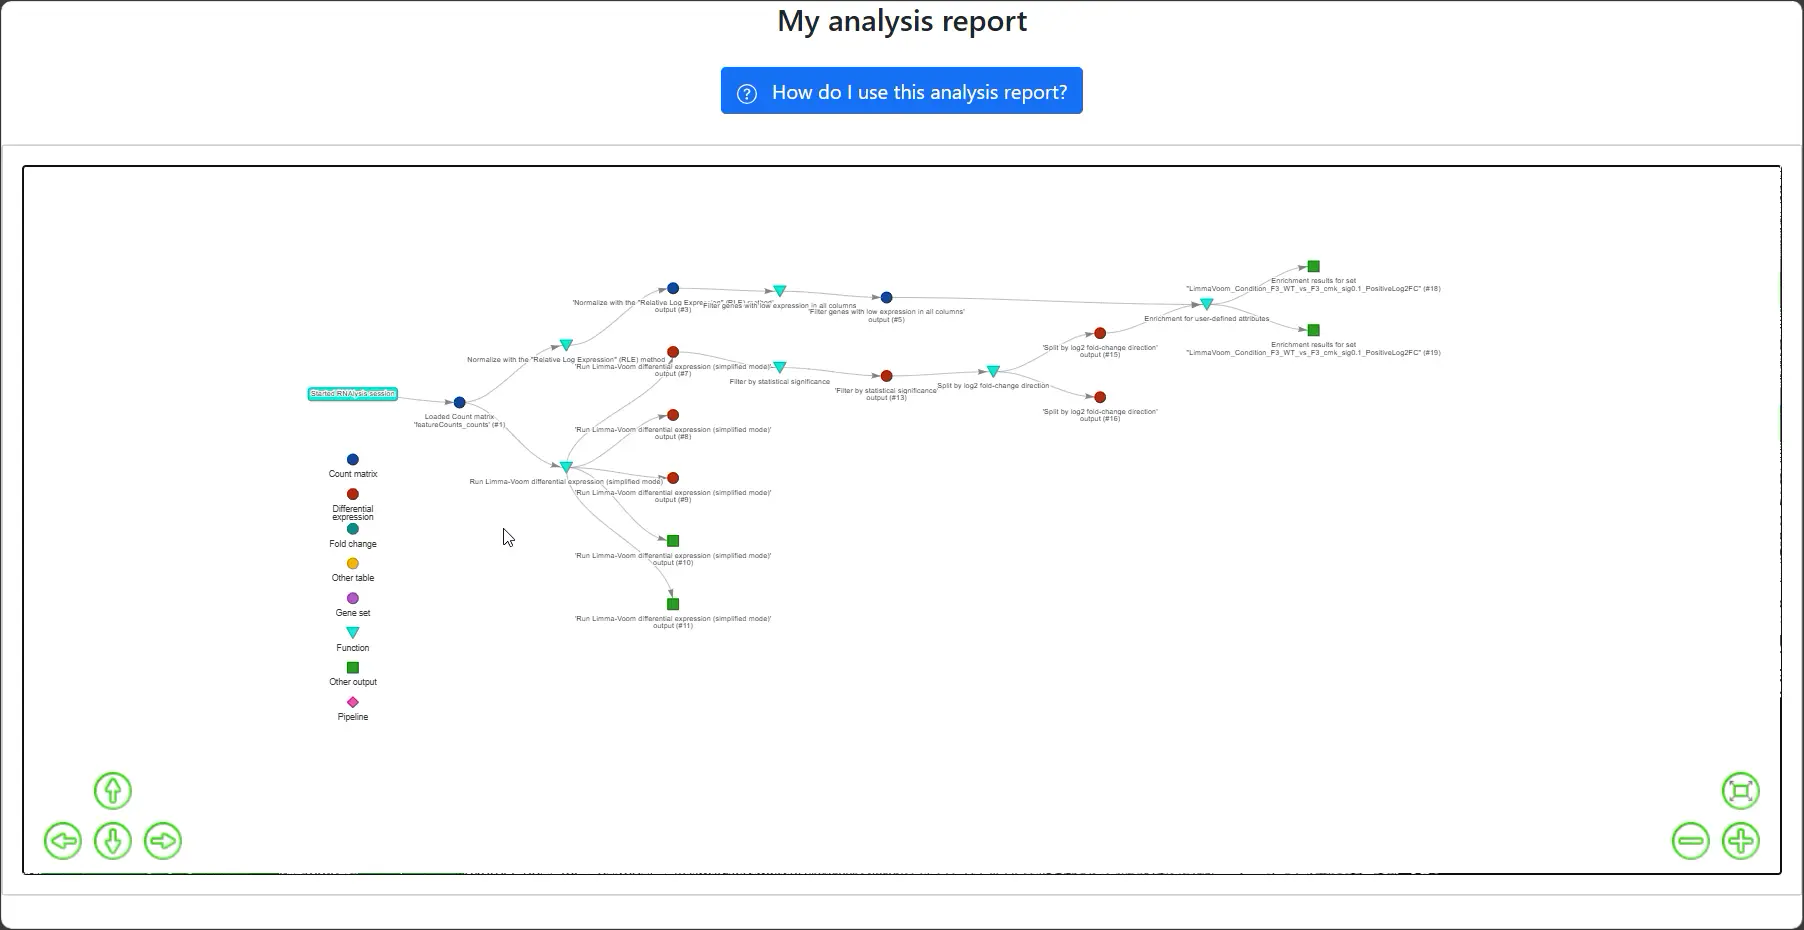
Fitting the Graph to View
Click the box-shaped button on the bottom-right to fit the entire graph into your current view.
Tracing Analysis Paths
Click on a node to highlight the path of analysis that led to it. Click again anywhere on the graph to reset the view.

Filtering by Node Type
Click on a node type in the legend to highlight all nodes of that type across the graph. Click again to reset the view.