rnalysis.filtering.CountFilter.split_hdbscan
- CountFilter.split_hdbscan(min_cluster_size: PositiveInt, min_samples: PositiveInt | None = 1, metric: str | Literal['Euclidean', 'Cosine', 'Pearson', 'Spearman', 'Manhattan', 'L1', 'L2', 'Jackknife', 'YS1', 'YR1', 'Sharpened_Cosine', 'Hamming'] = 'Euclidean', cluster_selection_epsilon: float = 0, cluster_selection_method: Literal['eom', 'leaf'] = 'eom', power_transform: bool = True, plot_style: Literal['all', 'std_area', 'std_bar'] = 'all', split_plots: bool = False, return_probabilities: bool = False, parallel_backend: Literal['multiprocessing', 'loky', 'threading', 'sequential'] = 'loky', gui_mode: bool = False) Tuple[CountFilter, ...] | List[Tuple[CountFilter, ...] | ndarray] | None
Clusters the features in the CountFilter object using the HDBSCAN clustering algorithm, and then splits those features into multiple non-overlapping CountFilter objects, based on the clustering result.
- Parameters:
min_cluster_size (int) – the minimum size of clusters the algorithm will seek. Larger values will lead to fewer, larger clusters.
min_samples (int or None (default=1)) – the number of samples in a neighbourhood for a point to be considered a core point. Higher values will lead to a more conservative clustering result, with more points being classified as noise. If min_samples is None, the algorithm will pick a value automatically
metric (str (default='Euclidean')) – the distance metric used to determine similarity between data points. For a full list of supported distance metrics see the user guide.
cluster_selection_epsilon (float (default=0.0)) – a distance threshold below which clusters will be merged.
cluster_selection_method ('eom' or 'leaf' (default='eom')) – The method used to select clusters from the condensed tree. ‘eom’ will use an Excess of Mass algorithm to find the most persistent clusters. ‘leaf’ will select the leaves of the tree, providing the most fine-grained and homogenous clusters.
power_transform (bool (default=True)) – if True, RNAlysis will apply a power transform (Box-Cox) to the data prior to clustering.
plot_style ('all', 'std_area', or 'std_bar' (default='all')) – determines the visual style of the cluster expression plot.
split_plots (bool (default=False)) – if True, each discovered cluster will be plotted on its own. Otherwise, all clusters will be plotted in the same Figure.
return_probabilities (bool (default False)) – if True, the algorithm will return an array containing the probability with which each sample is a member of its assigned cluster, in addition to returning the clustering results. Points which were categorized as noise have probability 0.
parallel_backend (Literal[PARALLEL_BACKENDS] (default='loky')) – Determines the babckend used to run the analysis. if parallel_backend not ‘sequential’, will calculate the statistical tests using parallel processing. In most cases parallel processing will lead to shorter computation time, but does not affect the results of the analysis otherwise.
- Returns:
if return_probabilities is False, returns a tuple of CountFilter objects, each corresponding to a discovered cluster. Otherswise, returns a tuple of CountFilter objects, and a numpy array containing the probability values.
- Examples:
>>> from rnalysis import filtering
>>> dev_stages = filtering.CountFilter('tests/test_files/elegans_developmental_stages.tsv')
>>> dev_stages.filter_low_reads(100)
Filtered 44072 features, leaving 2326 of the original 46398 features. Filtered inplace.
>>> clusters = dev_stages.split_hdbscan(min_cluster_size=75,metric='yr1',power_transform=True)
Found 14 clusters of average size 141.57. Number of unclustered genes is 344, which are 14.79% of the genes.
Filtered 2019 features, leaving 307 of the original 2326 features. Filtering result saved to new object.
Filtered 2122 features, leaving 204 of the original 2326 features. Filtering result saved to new object.
Filtered 2146 features, leaving 180 of the original 2326 features. Filtering result saved to new object.
Filtered 2168 features, leaving 158 of the original 2326 features. Filtering result saved to new object.
Filtered 2173 features, leaving 153 of the original 2326 features. Filtering result saved to new object.
Filtered 2176 features, leaving 150 of the original 2326 features. Filtering result saved to new object.
Filtered 2183 features, leaving 143 of the original 2326 features. Filtering result saved to new object.
Filtered 2192 features, leaving 134 of the original 2326 features. Filtering result saved to new object.
Filtered 2200 features, leaving 126 of the original 2326 features. Filtering result saved to new object.
Filtered 2234 features, leaving 92 of the original 2326 features. Filtering result saved to new object.
Filtered 2238 features, leaving 88 of the original 2326 features. Filtering result saved to new object.
Filtered 2241 features, leaving 85 of the original 2326 features. Filtering result saved to new object.
Filtered 2244 features, leaving 82 of the original 2326 features. Filtering result saved to new object.
Filtered 2246 features, leaving 80 of the original 2326 features. Filtering result saved to new object.
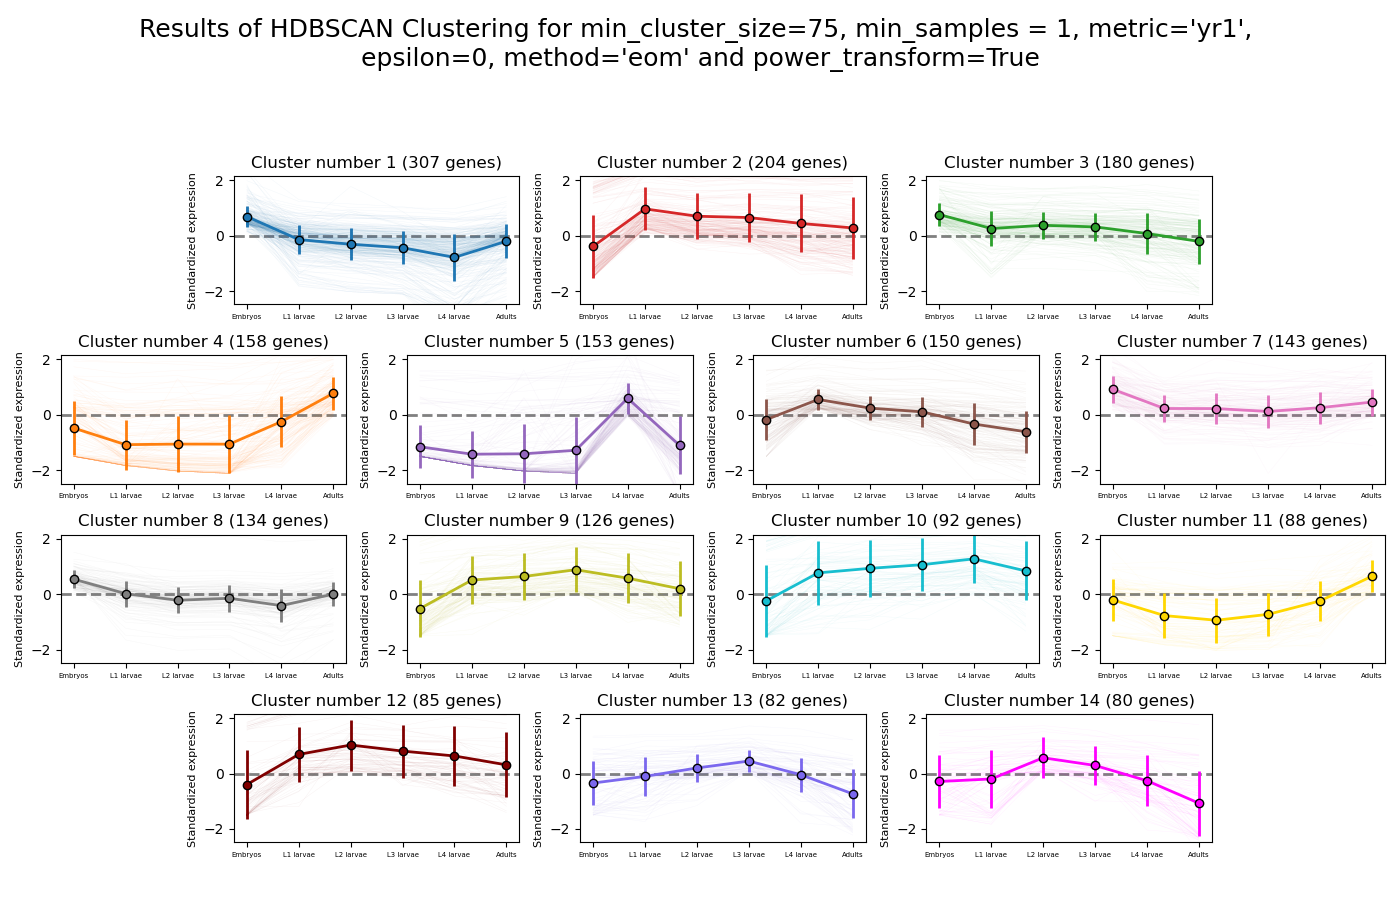
Example plot of split_hdbscan(plot_style=’all’)
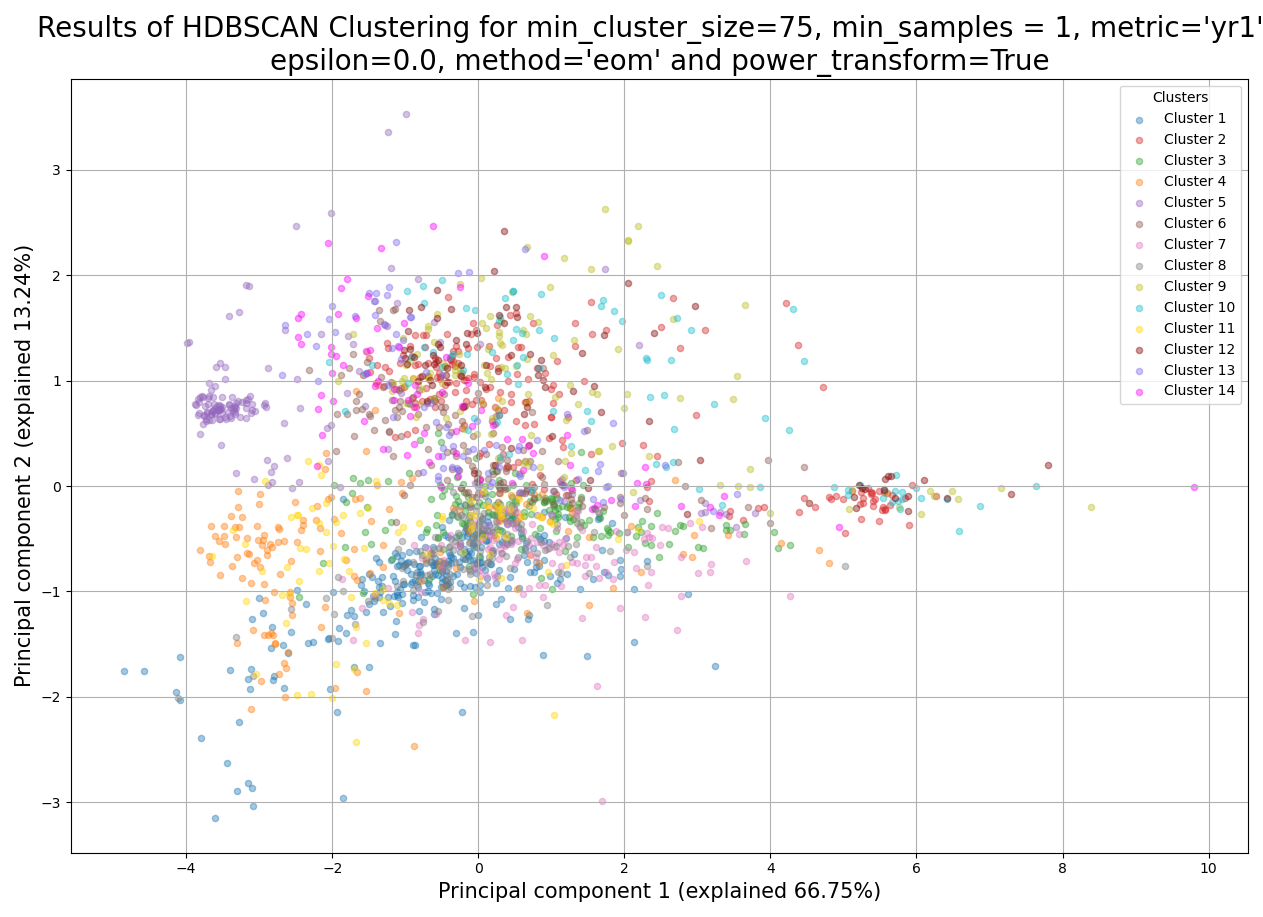
Example plot of split_hdbscan()