rnalysis.filtering.CountFilter.clustergram
- CountFilter.clustergram(sample_names: ColumnNames | Literal['all'] = 'all', metric: Literal['Correlation', 'Cosine', 'Euclidean', 'Jaccard'] | str = 'Euclidean', linkage: Literal['Single', 'Average', 'Complete', 'Ward', 'Weighted', 'Centroid', 'Median'] = 'Average', title: str | Literal['auto'] = 'auto', title_fontsize: float = 20, tick_fontsize: float = 12, colormap: ColorMap = 'inferno', colormap_label: Literal['auto'] | str = 'auto', cluster_columns: bool = True, log_transform: bool = True, z_score_rows: bool = False) Figure
Performs hierarchical clustering and plots a clustergram on the base-2 log of a given set of samples.
- Parameters:
z_score_rows (bool (default=False)) – if True, the rows will be z-scored before clustering. This will normalize the rows to have a mean of 0 and a standard deviation of 1, such that genes will be clustered based on the similarity of their expression pattern instead of absolute expression levels.
colormap_label (str or 'auto' (default='auto')) – label for the colorbar
cluster_columns (bool (default=True)) – if True, both rows and columns will be clustered. Otherwise, only the rows will be clustered, and columns will maintain their original order.
colormap (str) – the colormap to use in the clustergram.
log_transform (bool (default=True)) – if True, will apply a log transform (log2) to the data before clustering.
sample_names ('all' or list.) – the names of the relevant samples in a list. Example input: [“condition1_rep1”, “condition1_rep2”, “condition1_rep3”, “condition2_rep1”, “condition3_rep1”, “condition3_rep2”]
metric ('Euclidean', 'hamming', 'correlation', or any other distance metric available in scipy.spatial.distance.pdist) – the distance metric to use in the clustergram. For all possible inputs and their meaning see scipy.spatial.distance.pdist documentation online.
linkage ('single', 'average', 'complete', 'weighted', 'centroid', 'median' or 'ward'.) – the linkage method to use in the clustergram. For all possible inputs and their meaning see scipy.cluster.hierarchy.linkage documentation online.
title (str or 'auto' (default='auto')) – The title of the plot. If ‘auto’, a title will be generated automatically.
title_fontsize (float (default=30)) – determines the font size of the graph title.
tick_fontsize (float (default=10)) – determines the font size of the X and Y tick labels.
- Return type:
A matplotlib Figure.
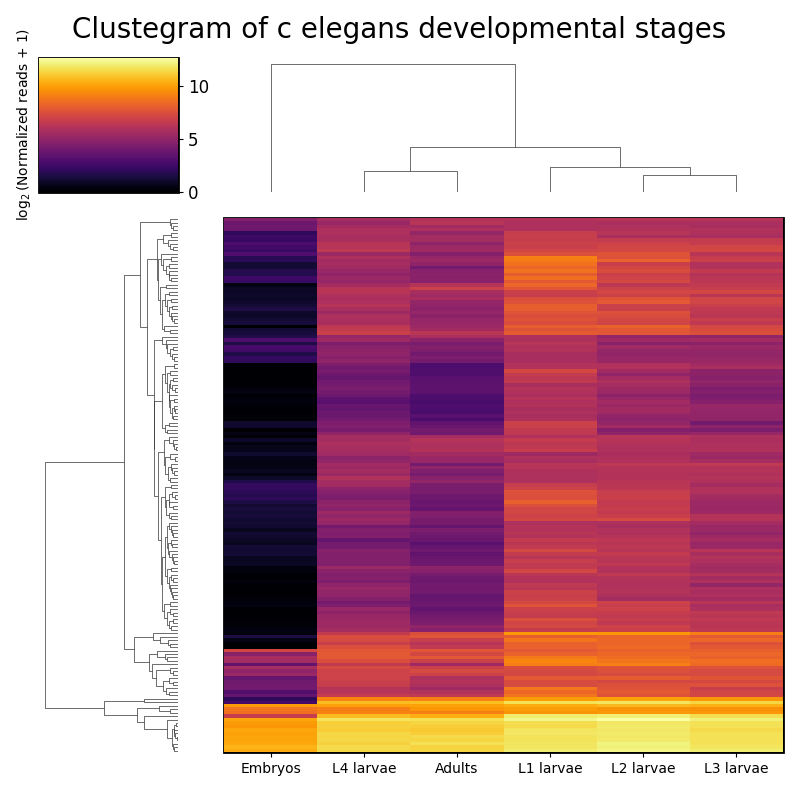
Example plot of clustergram()