rnalysis.filtering.CountFilter.plot_expression
- CountFilter.plot_expression(features: List[str] | str, samples: GroupedColumns | Literal['all'] = 'all', avg_function: Literal['mean', 'median', 'geometric_mean'] = 'mean', spread_function: Literal['sem', 'std', 'gstd', 'gsem', 'iqr', 'range'] = 'sem', bar_colors: ColorList = 'deepskyblue', edge_color: Color = 'black', scatter_color: Color = 'grey', count_unit: str = 'Normalized reads', split_plots: bool = False, jitter: Fraction = 0, group_names: List[str] | None = None, log_scale: bool = False) Figure
Plot the average expression and spread of the specified features under the specified conditions. :type features: str or list of strings :param features: the feature/features to plot expression for. :param samples: A list of the sample names and/or grouped sample names to be plotted. All specified samples must be present in the CountFilter object. To average multiple replicates of the same condition, they can be grouped in an inner list. Example input: [[‘SAMPLE1A’, ‘SAMPLE1B’, ‘SAMPLE1C’], [‘SAMPLE2A’, ‘SAMPLE2B’, ‘SAMPLE2C’],’SAMPLE3’ , ‘SAMPLE6’] :param avg_function: The function used to calculate the average expression value for each condition. :type avg_function: ‘mean’, ‘median’, or ‘geometric_mean’ (default=’mean’) :param spread_function: The function used to calculate the error bars of expression values for each condition. :type spread_function: ‘sem’, ‘std’, ‘gstd’, ‘gsem’, ‘iqr’, or ‘range’ (default=’sem’) :param bar_colors: The color or list of colors to use for the bars in the plot. :type bar_colors: str or list of color strings (default=’deepskyblue’) :param edge_color: The color of the edges around the bars. :type edge_color: str (default=’black’) :param scatter_color: The color of the scatter points representing individual samples. :type scatter_color: str (default=’grey’) :type count_unit: str (default=’Reads per million’) :param count_unit: The unit of the count data. Will be displayed in the y axis. :type split_plots: bool (default=False) :param split_plots: if True, each gene will be plotted in its own Figure. Otherwise, all genes will be plotted in the same Figure. :type jitter: float (default=0) :param jitter: The amount of jitter to apply to the scatter points. This can help visualize overlapping points. :type group_names: list of strings or None (default=None) :param group_names: Optionally, specify the names of the groups in the plot. If None, the names of the samples will be used. :type log_scale: bool (default=False) :param log_scale: If True, the y-axis will be displayed in logarithmic scale.
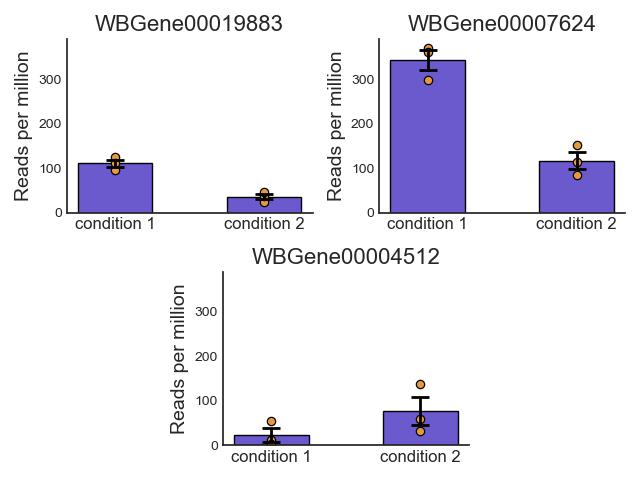
Example plot of plot_expression()