rnalysis.enrichment.RankedSet.user_defined_enrichment
- RankedSet.user_defined_enrichment(background_genes: Set[str] | Filter | FeatureSet, attributes: List[str] | str | List[int] | int | Literal['all'], statistical_test: Literal['fisher', 'hypergeometric', 'randomization'] = 'fisher', alpha: Fraction = 0.05, attr_ref_path: str | Path | Literal['predefined'] = 'predefined', exclude_unannotated_genes: bool = True, return_nonsignificant: bool = True, save_csv: bool = False, fname=None, return_fig: bool = False, plot_horizontal: bool = True, show_expected: bool = False, plot_style: Literal['bar', 'lollipop'] = 'bar', randomization_reps: PositiveInt = 10000, random_seed: int | None = None, parallel_backend: Literal['multiprocessing', 'loky', 'threading', 'sequential'] = 'loky', gui_mode: bool = False) DataFrame | Tuple[DataFrame, Figure]
Calculates enrichment and depletion of the FeatureSet for user-defined attributes against a background set. The attributes are drawn from an Attribute Reference Table. The background set is determined by either the input variable ‘background_genes’, or by the input variable ‘biotype’ and a Biotype Reference Table. P-values are corrected for multiple comparisons using the Benjamini–Hochberg step-up procedure (original FDR method). In plots, for the clarity of display, complete depletion (linear enrichment score = 0) appears with the smallest value in the scale.
- Parameters:
attributes (str, int, iterable (list, tuple, set, etc) of str/int, or 'all'.) – An iterable of attribute names or attribute numbers (according to their order in the Attribute Reference Table). If ‘all’, all of the attributes in the Attribute Reference Table will be used. If None, a manual input prompt will be raised.
statistical_test ('fisher', 'hypergeometric' or 'randomization' (default='fisher')) – determines the statistical test to be used for enrichment analysis. Note that some propagation methods support only some of the available statistical tests.
alpha (float between 0 and 1 (default=0.05)) – Indicates the FDR threshold for significance.
attr_ref_path (str or pathlib.Path (default='predefined')) – the path of the Attribute Reference Table from which user-defined attributes will be drawn.
biotype_ref_path (str or pathlib.Path (default='predefined')) – the path of the Biotype Reference Table. Will be used to generate background set if ‘biotype’ is specified.
biotype (str specifying a specific biotype, list/set of strings each specifying a biotype, or 'all' (default='protein_coding')) – determines the background genes by their biotype. Requires specifying a Biotype Reference Table. ‘all’ will include all genomic features in the reference table, ‘protein_coding’ will include only protein-coding genes from the reference table, etc. Cannot be specified together with ‘background_genes’.
background_genes (set of feature indices, filtering.Filter object, or enrichment.FeatureSet object) – a set of specific feature indices to be used as background genes.
exclude_unannotated_genes (bool (deafult=True)) – if True, genes that have no annotation associated with them will be excluded from the enrichment analysis. This is the recommended practice for enrichment analysis, since keeping unannotated genes in the analysis increases the chance of discovering spurious enrichment results.
return_nonsignificant (bool (default=True)) – if True (default), the results DataFrame will include all tested attributes - both significant and non-significant ones. If False, only significant attributes will be returned.
save_csv (bool (default=False)) – If True, will save the results to a .csv file, under the name specified in ‘fname’.
fname (str or pathlib.Path (default=None)) – The full path and name of the file to which to save the results. For example: ‘C:/dir/file’. No ‘.csv’ suffix is required. If None (default), fname will be requested in a manual prompt.
return_fig (bool (default=False)) – if True, returns a matplotlib Figure object in addition to the results DataFrame.
plot_horizontal (bool (default=True)) – if True, results will be plotted with a horizontal bar plot. Otherwise, results will be plotted with a vertical plot.
show_expected (bool (default=False)) – if True, the observed/expected values will be shown on the plot.
plot_style ('bar' or 'lollipop' (default='bar')) – style for the plot. Either ‘bar’ for a bar plot or ‘lollipop’ for a lollipop plot in which the lollipop size indicates the size of the observed gene set.
randomization_reps (int larger than 0 (default=10000)) – if using a randomization test, determine how many randomization repititions to run. Otherwise, this parameter will not affect the analysis.
parallel_backend (Literal[PARALLEL_BACKENDS] (default='loky')) – Determines the babckend used to run the analysis. if parallel_backend not ‘sequential’, will calculate the statistical tests using parallel processing. In most cases parallel processing will lead to shorter computation time, but does not affect the results of the analysis otherwise.
- Return type:
pl.DataFrame (default) or Tuple[pl.DataFrame, matplotlib.figure.Figure]
- Returns:
a pandas DataFrame with the indicated attribute names as rows/index; and a matplotlib Figure, if ‘return_figure’ is set to True.
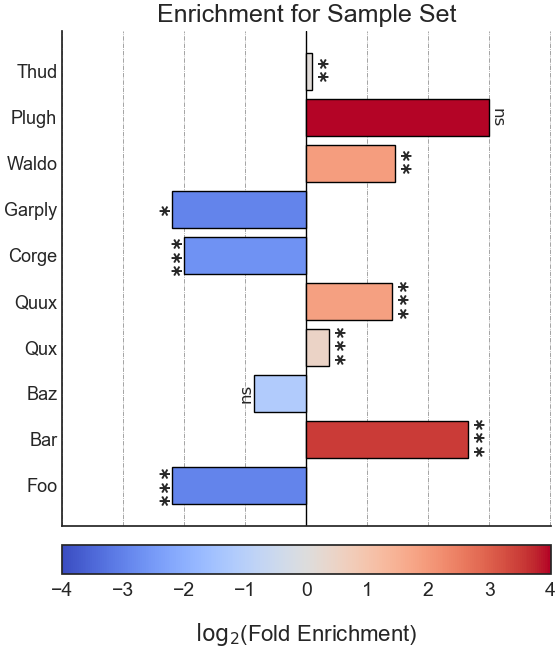
Example plot of user_defined_enrichment()
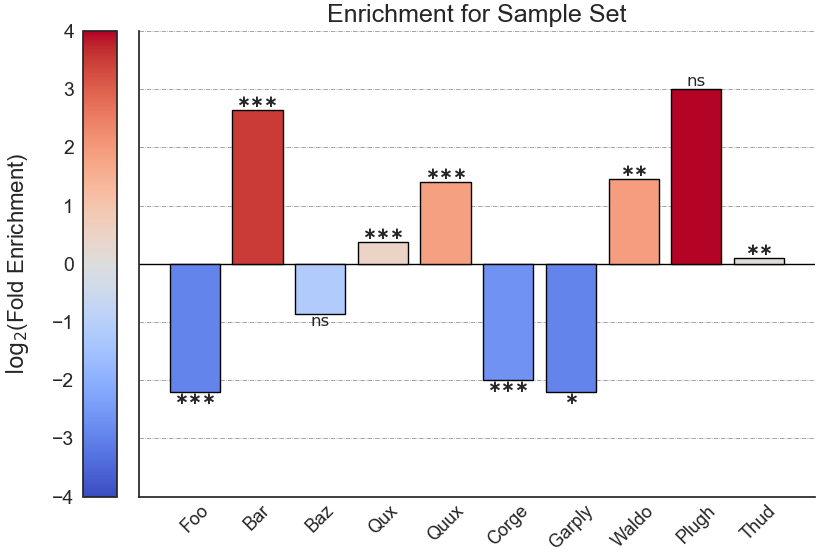
Example plot of user_defined_enrichment(plot_horizontal = False)