rnalysis.enrichment.RankedSet.single_set_enrichment
- RankedSet.single_set_enrichment(attributes: List[str] | str | List[int] | int | Literal['all'], alpha: Fraction = 0.05, min_positive_genes: PositiveInt = 10, lowest_cutoff: Fraction = 0.25, attr_ref_path: str | Path | Literal['predefined'] = 'predefined', exclude_unannotated_genes: bool = True, return_nonsignificant: bool = True, save_csv: bool = False, fname=None, return_fig: bool = False, plot_horizontal: bool = True, show_expected: bool = False, plot_style: Literal['bar', 'lollipop'] = 'bar', parallel_backend: Literal['multiprocessing', 'loky', 'threading', 'sequential'] = 'loky', gui_mode: bool = False)
Calculates enrichment and depletion of the sorted RankedSet for user-defined attributes WITHOUT a background set, using the generalized Minimum Hypergeometric Test (XL-mHG, developed by Prof. Zohar Yakhini and colleagues and generalized by Florian Wagner). The attributes are drawn from an Attribute Reference Table. P-values are calculated using using the generalized Minimum Hypergeometric Test. P-values are corrected for multiple comparisons using the Benjamini–Hochberg step-up procedure (original FDR method). In plots, for the clarity of display, complete depletion (linear enrichment = 0) appears with the smallest value in the scale.
- Parameters:
attributes (str, int, iterable (list, tuple, set, etc) of str/int, or 'all'.) – An iterable of attribute names or attribute numbers (according to their order in the Attribute Reference Table). If ‘all’, all of the attributes in the Attribute Reference Table will be used. If None, a manual input prompt will be raised.
alpha (float between 0 and 1) – Indicates the FDR threshold for significance.
attr_ref_path (str or pathlib.Path (default='predefined')) – path of the Attribute Reference Table from which user-defined attributes will be drawn.
exclude_unannotated_genes (bool (default=True)) – if True, genes that have no annotation associated with them will be excluded from the enrichment analysis. This is the recommended practice for enrichment analysis, since keeping unannotated genes in the analysis increases the chance of discovering spurious enrichment results.
return_nonsignificant (bool (default=True)) – if True (default), the results DataFrame will include all tested attributes - both significant and non-significant ones. If False, only significant attributes will be returned.
min_positive_genes (a positive int (default=10)) – the minimum number of ‘positive’ genes (genes that match the given attribute) for the enrichment to be considered a valid enrichment. All hypergeometric cutoffs with a smaller number of ‘positive’ genes will not be tested. This is the ‘X’ parameter of the XL-mHG nonparametric test. For example: a value of 10 means that a valid enrichment must have at least 10 ‘positive’ genes to be considered real enrichment.
lowest_cutoff (float between 0 and 1 (default=0.25)) – the lowest cutoff of the hypergeometric that will be tested. This determines the ‘L’ parameter of the XL-mHG nonparametric test. For example: a value of 1 means that every cutoff will be tested. A value of 0.25 means that every cutoff that compares the top 25% or smaller of the list to the rest of the list will be tested.
save_csv (bool, default False) – If True, will save the results to a .csv file, under the name specified in ‘fname’.
fname (str or pathlib.Path) – The full path and name of the file to which to save the results. For example: ‘C:/dir/file’. No ‘.csv’ suffix is required. If None (default), fname will be requested in a manual prompt.
return_fig (bool (default=False)) – if True, returns a matplotlib Figure object in addition to the results DataFrame.
plot_horizontal (bool (default=True)) – if True, results will be plotted with a horizontal bar plot. Otherwise, results will be plotted with a vertical plot.
show_expected (bool (default=False)) – if True, the observed/expected values will be shown on the plot.
plot_style ('bar' or 'lollipop' (default='bar')) – style for the plot. Either ‘bar’ for a bar plot or ‘lollipop’ for a lollipop plot in which the lollipop size indicates the size of the observed gene set.
parallel_backend (Literal[PARALLEL_BACKENDS] (default='loky')) – Determines the babckend used to run the analysis. if parallel_backend not ‘sequential’, will calculate the statistical tests using parallel processing. In most cases parallel processing will lead to shorter computation time, but does not affect the results of the analysis otherwise.
- Return type:
pl.DataFrame (default) or Tuple[pl.DataFrame, matplotlib.figure.Figure]
- Returns:
a pandas DataFrame with the indicated attribute names as rows/index; and a matplotlib Figure, if ‘return_figure’ is set to True.
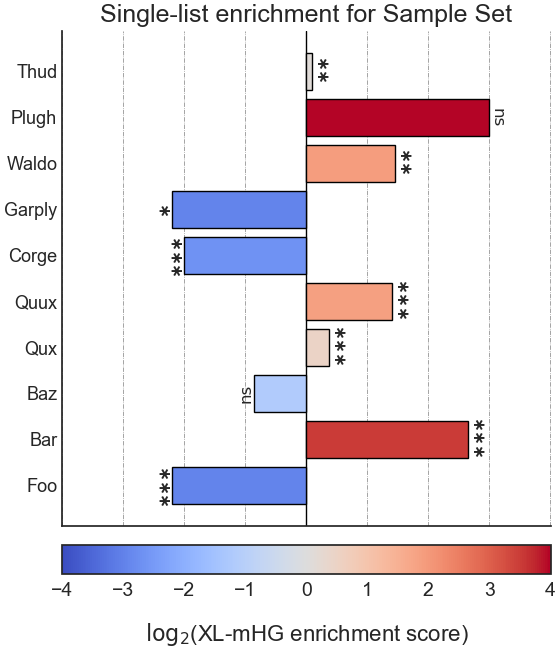
Example plot of single_set_enrichment()
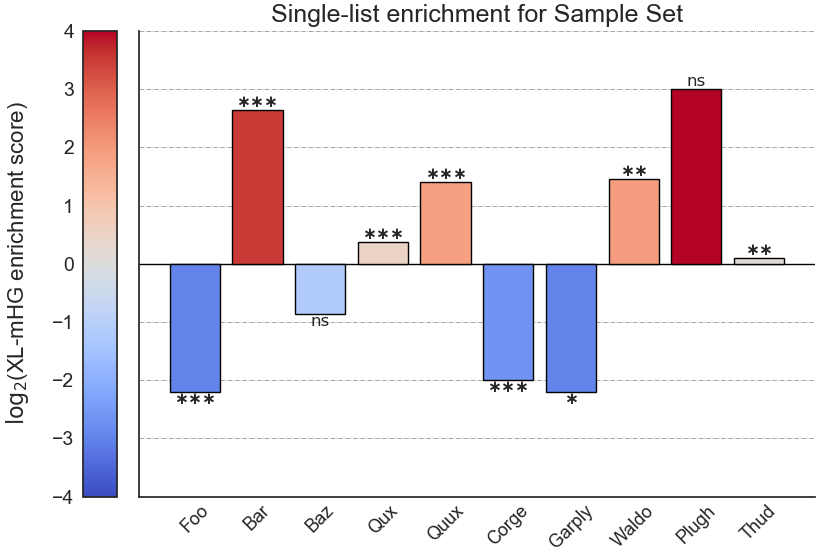
Example plot of single_set_enrichment(plot_horizontal = False)