rnalysis.enrichment.upset_plot
- rnalysis.enrichment.upset_plot(objs: Dict[str, str | FeatureSet | Set[str]], set_colors: ColorList = ('black',), title: str = 'UpSet Plot', title_fontsize: float = 20, show_percentages: bool = True, attr_ref_table_path: str | Path | Literal['predefined'] = 'predefined', fig: Figure = None) Figure
Generate an UpSet plot of 2 or more sets, FeatureSets or attributes from the Attribute Reference Table.
- Parameters:
objs (a dictionary with 2 or more entries, where the keys are the names of the sets, and the values are either a FeatureSet, a python set of feature indices, or a name of a column in the Attribute Reference Table. For example: {'first set':{'gene1','gene2','gene3'}, 'second set':'name_of_attribute_from_reference_table'}) – the FeatureSets, python sets or user-defined attributes to plot.
set_colors (Iterable of colors (default=('black',)) – If one color is supplied, this will determine the color of all sets on the plot. If multiple colors are supplied, this will determine the color of each set on the plot, and the subset colors will be determined by mixing.
title (str) – determines the title of the plot.
title_fontsize (float (default=20)) – font size for the plot’s title
show_percentages (bool (default=True)) – if True, shows the percentage that each set or subset takes out of the entire dataset.
attr_ref_table_path (str or pathlib.Path (default='predefined')) – the path of the Attribute Reference Table from which user-defined attributes will be drawn, if such attributes are included in ‘objs’.
fig (matplotlib.Figure) – optionally, supply your own Figure to generate the plot onto.
- Returns:
plt.Figure
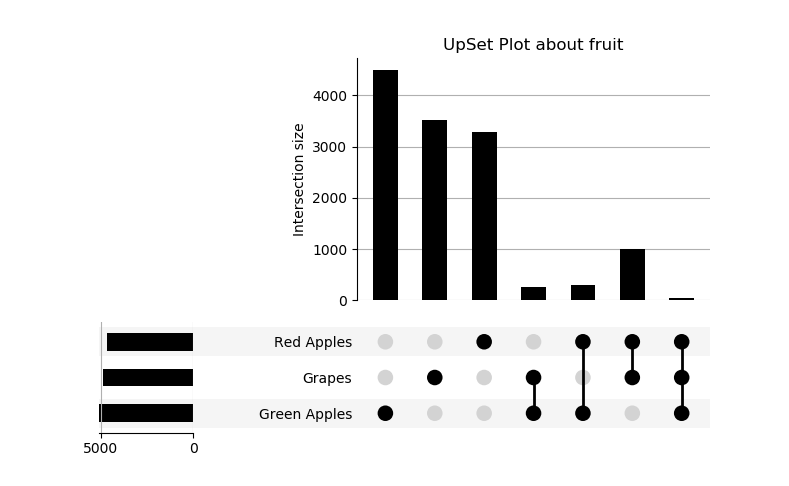
Example plot of upset_plot()