rnalysis.enrichment.venn_diagram
- rnalysis.enrichment.venn_diagram(objs: Dict[str, str | FeatureSet | Set[str]], title: str | Literal['default'] = 'default', attr_ref_table_path: str | Path | Literal['predefined'] = 'predefined', set_colors: ColorList = ('r', 'g', 'b'), transparency: Fraction = 0.4, weighted: bool = True, add_outline: bool = True, linecolor: Color = 'black', linestyle: Literal['solid', 'dashed'] = 'solid', linewidth: float = 2.0, title_fontsize: float = 14, set_fontsize: float = 12, subset_fontsize: float = 10, fig: Figure = None, **legacy_args) Figure
Generate a Venn diagram of 2 to 3 sets, FeatureSets or attributes from the Attribute Reference Table.
- Parameters:
objs (a dictionary with 2-3 entries, where the keys are the names of the sets, and the values are either a FeatureSet, a python set of feature indices, or a name of a column in the Attribute Reference Table. For example: {'first set':{'gene1','gene2','gene3'}, 'second set':'name_of_attribute_from_reference_table'}) – the FeatureSets, python sets or user-defined attributes to plot.
set_colors (tuple of matplotlib-format colors, the same size as 'objs') – determines the colors of the circles in the diagram.
attr_ref_table_path (str or pathlib.Path (default='predefined')) – the path of the Attribute Reference Table from which user-defined attributes will be drawn, if such attributes are included in ‘objs’.
title (str or 'default' (default='default')) – determines the title of the plot.
transparency (a float between 0 and 1) – determines the opacity of the circles. Opacity of 0 is completely transparent, while opacity of 1 is completely opaque.
weighted (bool (default=True)) – if True, the plot will be area-weighted.
add_outline (bool (default=True)) – if True, adds an outline to the circles.
linecolor (matplotlib-format color (default='black')) – Determines the color of the circles’ outline.
linestyle ('solid' or 'dashed' (default='solid')) – the style of the circles’ outline.
linewidth (float (default=2.0)) – the widdth of the circles’ outlines.
title_fontsize (float (default=14)) – font size for the plot’s title.
set_fontsize (float (default=12)) – font size for the set labels.
subset_fontsize (float (default=10)) – font size for the subset labels.
fig (matplotlib.Figure) – optionally, supply your own Figure to generate the plot onto.
- Returns:
a tuple of a VennDiagram object; and a list of 2-3 Circle patches.
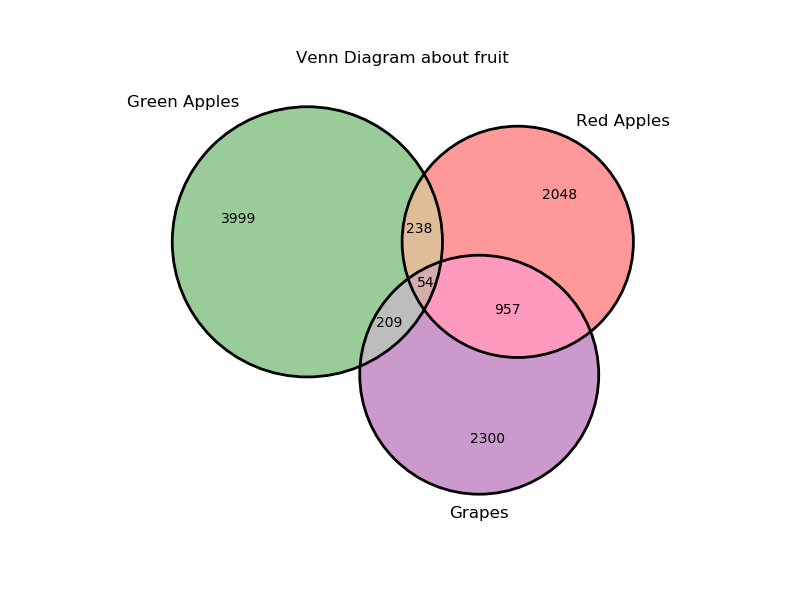
Example plot of venn_diagram()