rnalysis.enrichment.RankedSet.non_categorical_enrichment
- RankedSet.non_categorical_enrichment(background_genes: Set[str] | Filter | FeatureSet, attributes: List[str] | str | List[int] | int | Literal['all'], alpha: Fraction = 0.05, parametric_test: bool = False, attr_ref_path: str | Path | Literal['predefined'] = 'predefined', plot_log_scale: bool = True, plot_style: Literal['interleaved', 'overlap'] = 'overlap', n_bins: PositiveInt = 50, save_csv: bool = False, fname=None, return_fig: bool = False, gui_mode: bool = False) DataFrame | Tuple[DataFrame, List[Figure]]
Calculates enrichment and depletion of the FeatureSet for user-defined non-categorical attributes against a background set using either a one-sample T-test or Sign test. The attributes are drawn from an Attribute Reference Table. The background set is determined by either the input variable ‘background_genes’, or by the input variable ‘biotype’ and a Biotype Reference Table. P-values are corrected for multiple comparisons using the Benjamini–Hochberg step-up procedure (original FDR method).
- Parameters:
attributes (str, int, iterable (list, tuple, set, etc) of str/int, or 'all'.) – An iterable of attribute names or attribute numbers (according to their order in the Attribute Reference Table). If ‘all’, all of the attributes in the Attribute Reference Table will be used. If None, a manual input prompt will be raised.
alpha (float between 0 and 1 (default=0.05)) – Indicates the FDR threshold for significance.
parametric_test (bool (default=False)) – if True, performs a parametric statistical test (one-sample t-test). If False (default), performs a non-parametric statistical test (sign test).
background_genes (set of feature indices, filtering.Filter object, or enrichment.FeatureSet object) – a set of specific feature indices to be used as background genes.
attr_ref_path (str or pathlib.Path (default='predefined')) – the path of the Attribute Reference Table from which user-defined attributes will be drawn.
plot_log_scale (bool (default=True)) – if True (default), the Y-axis of the enrichment plot will be logarithmic. Otherwise, the Y-axis of the enrichment plot will be linear.
plot_style ('overlap' or 'interleaved' (default='overlap')) – ‘interleaved’ will plot an interleaved histogram. ‘overlap’ will plot a semi-transparent histogram where the obsreved and expected are overlapping.
n_bins (int larger than 0 (default=50)) – the number of bins to display in the enrichment plot histograms
save_csv (bool (default=False)) – If True, will save the results to a .csv file, under the name specified in ‘fname’.
fname (str or pathlib.Path (default=None)) – The full path and name of the file to which to save the results. For example: ‘C:/dir/file’. No ‘.csv’ suffix is required. If None (default), fname will be requested in a manual prompt.
return_fig (bool (default=False)) – if True, returns a matplotlib Figure object in addition to the results DataFrame.
- Return type:
pl.DataFrame (default) or Tuple[pl.DataFrame, matplotlib.figure.Figure]
- Returns:
a pandas DataFrame with the indicated attribute names as rows/index; and a matplotlib Figure, if ‘return_figure’ is set to True.
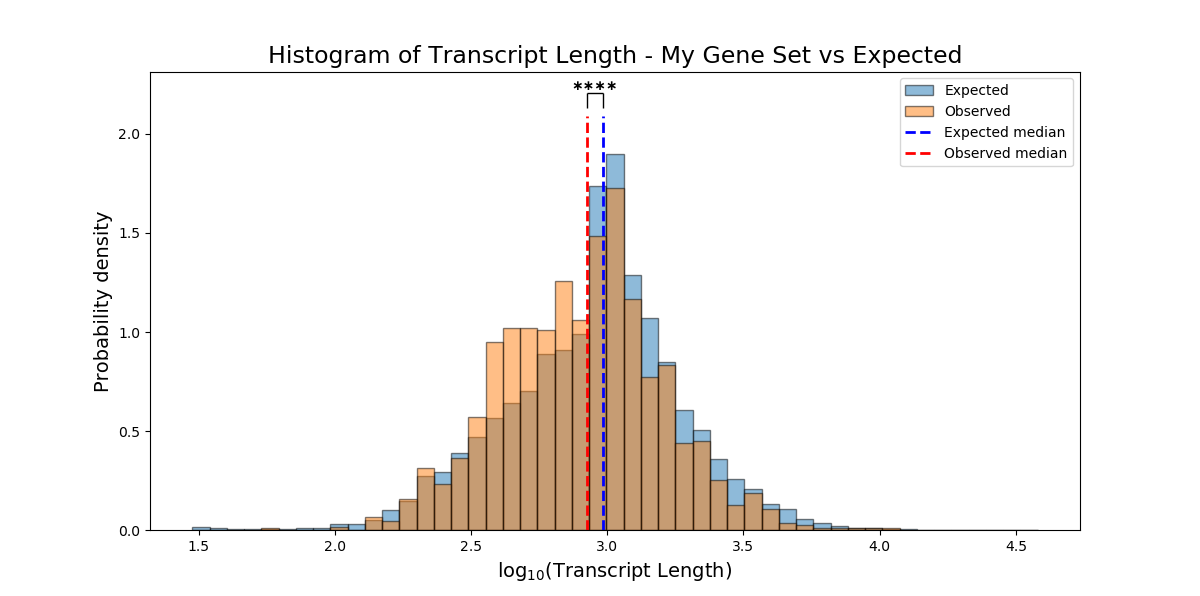
Example plot of non_categorical_enrichment(plot_style`=’overlap’)
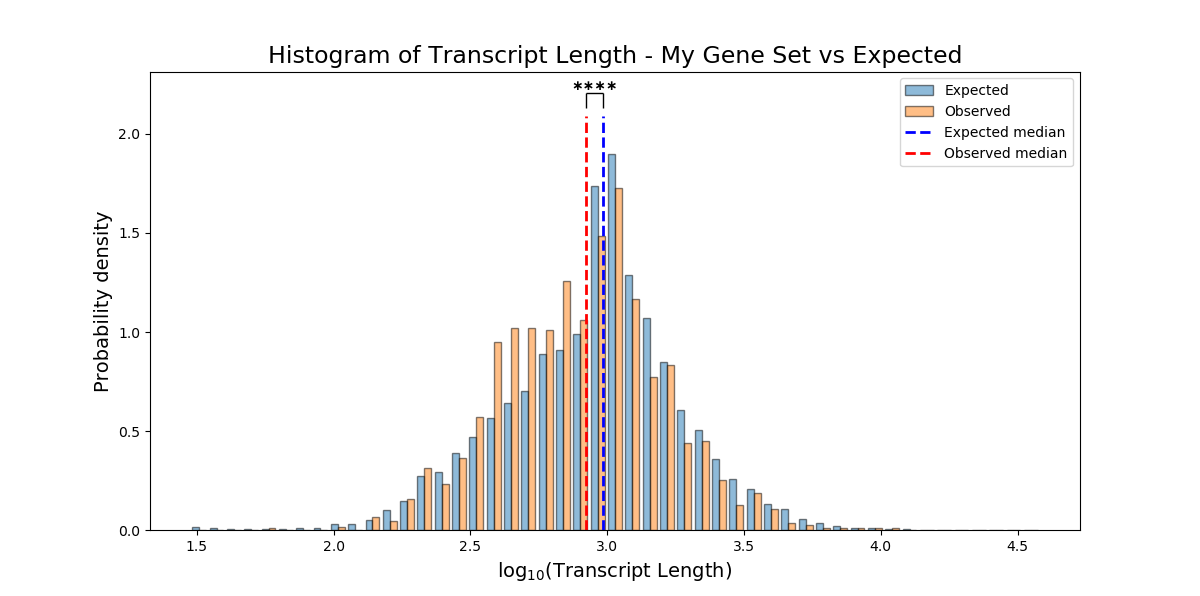
Example plot of non_categorical_enrichment(plot_style=’interleaved’)