rnalysis.enrichment.FeatureSet.kegg_enrichment
- FeatureSet.kegg_enrichment(background_genes: Set[str] | Filter | FeatureSet, organism: str | int | Literal['auto'] | Literal['Arabodopsis thaliana', 'Caenorhabditis elegans', 'Danio rerio', 'Drosophila melanogaster', 'Escherichia coli', 'Homo sapiens', 'Mus musculus', 'Saccharomyces cerevisiae', 'Schizosaccharomyces pombe'] = 'auto', gene_id_type: str | Literal['auto'] | Literal['UniProtKB AC/ID', 'UniParc', 'UniRef50', 'UniRef90', 'UniRef100', 'Gene Name', 'CRC64', 'Proteome ID', 'Ensembl', 'Ensembl Genomes', 'Ensembl Genomes Protein', 'Ensembl Genomes Transcript', 'Ensembl Protein', 'Ensembl Transcript', 'GeneID', 'KEGG', 'PATRIC', 'UCSC', 'WBParaSite', 'WBParaSite Transcript/Protein', 'ArachnoServer', 'Araport', 'CGD', 'ClinPGx', 'ConoServer', 'dictyBase', 'EchoBASE', 'euHCVdb', 'FlyBase', 'GeneCards', 'GeneReviews', 'HGNC', 'LegioList', 'Leproma', 'MaizeGDB', 'MGI', 'MIM', 'OpenTargets', 'Orphanet', 'PomBase', 'PseudoCAP', 'RGD', 'SGD', 'TubercuList', 'VEuPathDB', 'VGNC', 'WormBase', 'WormBase Protein', 'WormBase Transcript', 'Xenbase', 'ZFIN', 'eggNOG', 'GeneTree', 'HOGENOM', 'OMA', 'OrthoDB', 'CCDS', 'EMBL/GenBank/DDBJ', 'EMBL/GenBank/DDBJ CDS', 'GI number', 'PIR', 'RefSeq Nucleotide', 'RefSeq Protein', 'ChiTaRS', 'GeneWiki', 'GenomeRNAi', 'PHI-base', 'CollecTF', 'BioCyc', 'PlantReactome', 'Reactome', 'UniPathway', 'CPTAC', 'ProteomicsDB'] = 'auto', alpha: Fraction = 0.05, statistical_test: Literal['fisher', 'hypergeometric', 'randomization'] = 'fisher', exclude_unannotated_genes: bool = True, return_nonsignificant: bool = False, save_csv: bool = False, fname=None, return_fig: bool = False, plot_horizontal: bool = True, show_expected: bool = False, plot_style: Literal['bar', 'lollipop'] = 'bar', plot_pathway_graphs: bool = True, pathway_graphs_format: Literal['pdf', 'png', 'svg', 'none'] = 'none', randomization_reps: PositiveInt = 10000, random_seed: int | None = None, parallel_backend: Literal['multiprocessing', 'loky', 'threading', 'sequential'] = 'loky', gui_mode: bool = False) DataFrame | Tuple[DataFrame, Figure]
Calculates enrichment and depletion of the FeatureSet for Kyoto Encyclopedia of Genes and Genomes (KEGG) curated pathways against a background set. The background set is determined by either the input variable ‘background_genes’, or by the input variable ‘biotype’ and a Biotype Reference Table. P-values are corrected for multiple comparisons using the Benjamini–Hochberg step-up procedure (original FDR method). In plots, for the clarity of display, complete depletion (linear enrichment score = 0) appears with the smallest value in the scale.
- Parameters:
organism (str or int) – organism name or NCBI taxon ID for which the function will fetch GO annotations.
gene_id_type (str or 'auto' (default='auto')) – the identifier type of the genes/features in the FeatureSet object (for example: ‘UniProtKB’, ‘WormBase’, ‘RNACentral’, ‘Entrez Gene ID’). If the annotations fetched from the KEGG server do not match your gene_id_type, RNAlysis will attempt to map the annotations’ gene IDs to your identifier type. For a full list of legal ‘gene_id_type’ names, see the UniProt website: https://www.uniprot.org/help/api_idmapping
alpha (float between 0 and 1 (default=0.05)) – Indicates the FDR threshold for significance.
statistical_test ('fisher', 'hypergeometric' or 'randomization' (default='fisher')) – determines the statistical test to be used for enrichment analysis. Note that some propagation methods support only some of the available statistical tests.
background_genes (set of feature indices, filtering.Filter object, or enrichment.FeatureSet object) – a set of specific feature indices to be used as background genes.
exclude_unannotated_genes (bool (deafult=True)) – if True, genes that have no annotation associated with them will be excluded from the enrichment analysis. This is the recommended practice for enrichment analysis, since keeping unannotated genes in the analysis increases the chance of discovering spurious enrichment results.
return_nonsignificant (bool (default=False)) – if True, the results DataFrame will include all tested pathways - both significant and non-significant ones. If False (default), only significant pathways will be returned.
save_csv (bool, default False) – If True, will save the results to a .csv file, under the name specified in ‘fname’.
fname (str or pathlib.Path) – The full path and name of the file to which to save the results. For example: ‘C:/dir/file’. No ‘.csv’ suffix is required. If None (default), fname will be requested in a manual prompt.
return_fig (bool (default=False)) – if True, returns a matplotlib Figure object in addition to the results DataFrame.
plot_horizontal (bool (default=True)) – if True, results will be plotted with a horizontal bar plot. Otherwise, results will be plotted with a vertical plot.
show_expected (bool (default=False)) – if True, the observed/expected values will be shown on the plot.
plot_style ('bar' or 'lollipop' (default='bar')) – style for the plot. Either ‘bar’ for a bar plot or ‘lollipop’ for a lollipop plot in which the lollipop size indicates the size of the observed gene set.
plot_pathway_graphs (bool (default=True)) – if True, will generate pathway graphs depicting the significant KEGG pathways.
pathway_graphs_format ('pdf', 'png', 'svg', or None (default=None)) – if pathway_graphs_format is not ‘none’, the pathway graphs will additonally be generated in the specified file format.
randomization_reps (int larger than 0 (default=10000)) – if using a randomization test, determine how many randomization repititions to run. Otherwise, this parameter will not affect the analysis.
parallel_backend (Literal[PARALLEL_BACKENDS] (default='loky')) – Determines the babckend used to run the analysis. if parallel_backend not ‘sequential’, will calculate the statistical tests using parallel processing. In most cases parallel processing will lead to shorter computation time, but does not affect the results of the analysis otherwise.
- Return type:
pl.DataFrame (default) or Tuple[pl.DataFrame, matplotlib.figure.Figure]
- Returns:
a pandas DataFrame with the indicated pathway names as rows/index; and a matplotlib Figure, if ‘return_figure’ is set to True.
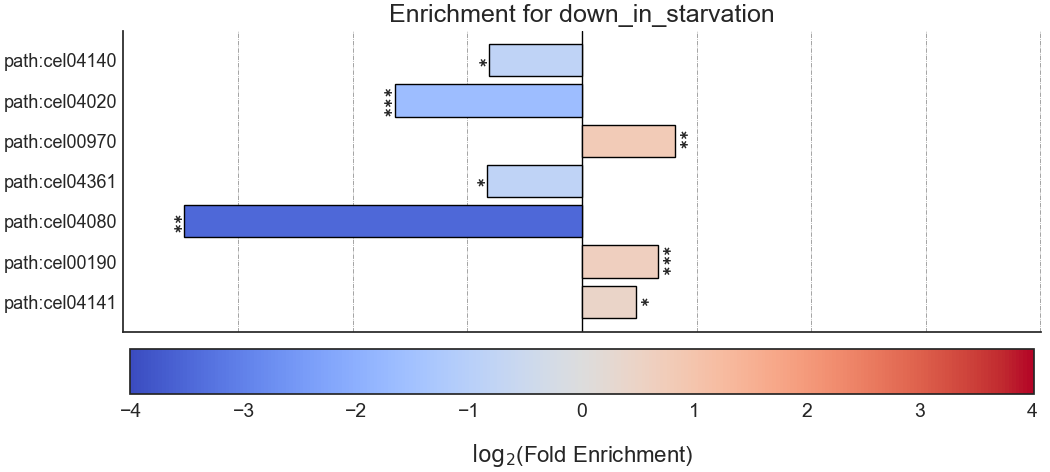
Example plot of kegg_enrichment()
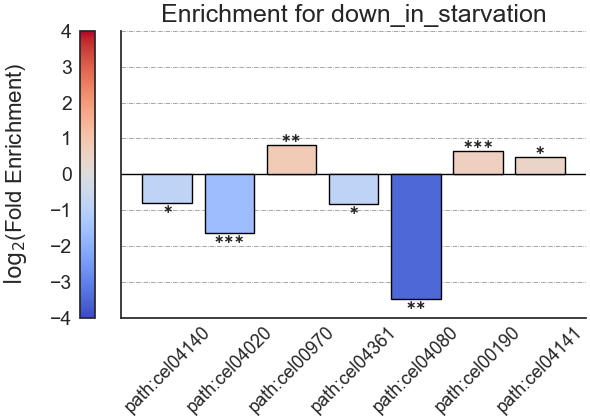
Example plot of kegg_enrichment(plot_horizontal = False)