rnalysis.filtering.DESeqFilter.volcano_plot
- DESeqFilter.volcano_plot(alpha: Fraction = 0.1, log2fc_threshold: float | None = 1, title: str | Literal['auto'] = 'auto', title_fontsize: float = 16, label_fontsize: float = 16, tick_fontsize: float = 12, annotation_fontsize: float = 10, point_size: float = 10, opacity: Fraction = 0.65, interactive: bool = True, show_cursor: bool = False) Figure
Plots a volcano plot (log2(fold change) vs -log10(adj. p-value)) of the DESeqFilter object. Significantly upregulated features are colored in red, and significantly downregulated features are colored in blue. If the plot is generated in interactive mode, data points can be labeled by clicking on them.
- Parameters:
alpha (float between 0 and 1) – the significance threshold to paint data points as significantly up/down-regulated.
log2fc_threshold (non-negative float or None (default=1)) – the absolute log2(fold change) threshold to paint data as significantly up/down-regulated. if log2fc_threshold is None, no threshold will be used.
title (str or 'auto' (default='auto')) – The title of the plot. If ‘auto’, a title will be generated automatically.
title_fontsize (float (default=30)) – determines the font size of the graph title.
label_fontsize (float (default=15) :param tick_fontsize: determines the font size of the X and Y tick labels.) – determines the font size of the X and Y axis labels.
annotation_fontsize (float (default=10)) – determines the font size of the point annotations created in interactive mode.
opacity (determines the opacity of the points in the scatter plot. 0 indicates completely transparent, while 1 indicates completely opaque.) – float between 0 and 1 (default=0.65)
point_size (float (default=10)) – determines the size of the points in the scatter plot
interactive (bool (default=True)) – if True, turns on interactive mode. While in interactive mode, you can click on a data point to label it with its gene name/ID, or click on a labeled data point to unlabel it.
show_cursor (bool (default=False)) – if True, show the cursor position on the plot during interactive mode
- Return type:
A matplotlib Figure
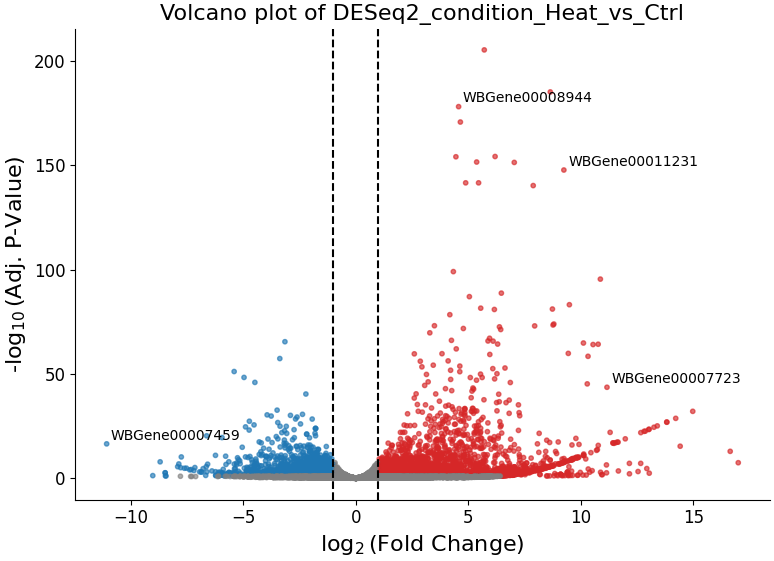
Example plot of volcano_plot()